
Hi everyone,
I’m working on a project where I want to show users the "real-time" environmental impact of some specific trees in their environment. The goal is to display an estimated oxygen (O2) production value that fluctuates based on current conditions, making the tree's biological activity more "visible" to the average user.
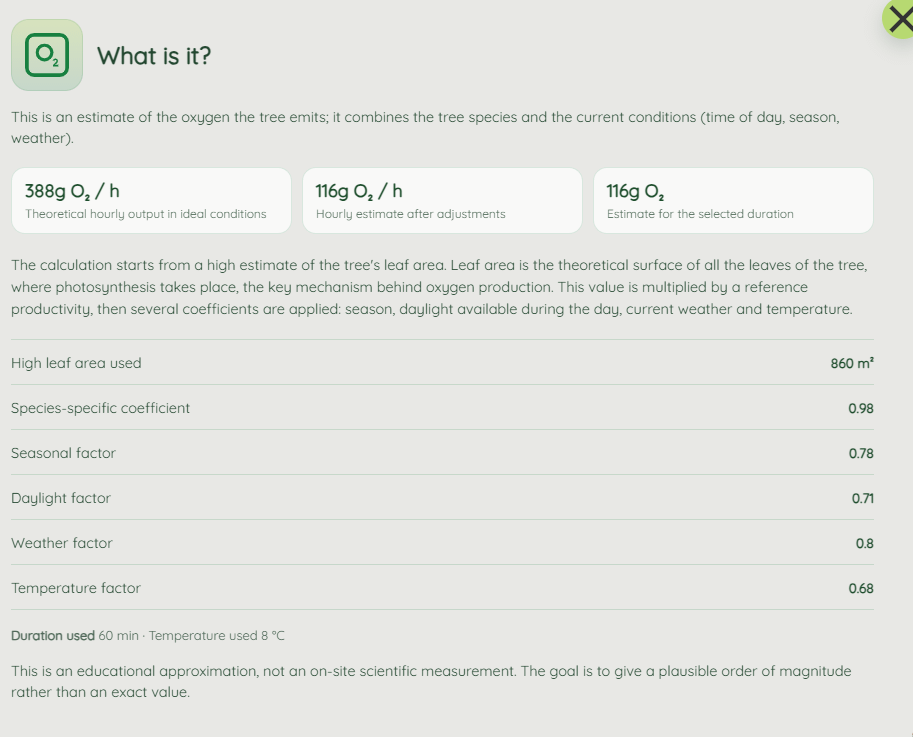
Since I can't measure the exact Leaf Area of every tree, I’ve built a logic based on estimations and environmental modifiers (see the screenshot for my current breakdown).
The logic follows this flow:
- Base: A high-level estimate of the tree's leaf surface area.
- Live Adjustments: I apply reductive coefficients based on real-time weather data (temperature, cloud cover, light levels) and the current season.
I’m looking for a "sanity check" from the botanical community:
- The "Live" Aspect: Does it make sense from a physiological standpoint to scale O2 production based on immediate weather/light factors for a public-facing tool, or are these fluctuations too complex to simplify into a few coefficients?
- Order of Magnitude: Looking at the numbers in the screenshot for a large tree in these specific conditions), does this feel like a plausible "educational" estimate, or is it wildly over/under-estimated?
- The "Species" Variable: I'm using a species-specific coefficient to adjust the metabolic rate. Are there specific common urban species that are known to be "outliers" (way more or way less efficient) that I should be careful with?
I’m trying to find the right balance between scientific honesty and making plant physiology accessible to non-experts. I'd love to hear your thoughts on how to make this estimation as "correct" as possible within these constraints.
Thanks!
by korvusdotfree
Comments are closed.