
Abstract (TLDR:)
This is the conclusion and findings of the 2025 iteration of my ongoing substrate comparison experiment. In this test I am potting seedlings into different soil compositions to learn about their differences in effect on water retention, nutrient holding capacity, nutrient exchange rate, and root development. This is not a test of which substrate leads to fastest growth, that can not be compared here because these are unique seed grown phenotypes. You can find last years iteration of this test here: https://old.reddit.com/r/sanpedrocactus/comments/1ju1qum/substrate\_test\_2024\_conclusion/
Method
Twelve seedlings were selected, 6 of bridge Lumberjack x bridge Eileen parentage and 6 of peru Rosei2 x peru Sharxx Blue parentage, all of similar size. One of each was potted into 6 unique substrates in half gallon black plastic pots with window screen in the bottom. Over the course of ten and a half months the pots were mixed in with the rest of my seedlings (identical to Control) and treated the same way – kept outdoors in the bay area, CA with the same watering schedule and product applications including regular use of Masterblend fertilizer and occasional applications of Jones Juice, Dune Si, and Recharge. Monitoring parameters included checking the pH and nutrient concentration of runoff near monthly, sometimes with water pour through and sometimes with nutrient feed pour through, checking soil drying time, surface soil compaction and checking root health at end of the experiment. Results of both pots of each substrate were averaged for each test.
Substrates
Control:
33% new inorganic
17% biochar pre-charged with masterblend
33% recycled substrate containing ~1/4 used up organics and 3/4 inorganic drainage component
17% composted organics + organic amendment mix, which contains:
earthworm castings
Alfalfa meal from Greenway biotech 2.5-0-2.5.
Basalt rock dust from Gaia green containing ca 1.7, mg 1, fe 5.5, mgns 0.08.
Insect Frass from Gaia green 3-1-2
Fish bone meal from Greenway biotech 4-17-0
Kelp meal
Mix #1
33% new inorganic
17% biochar pre-charged with masterblend
33% recycled substrate containing 1/4 used up organics and 3/4 inorganic drainage component
17% composted organics + organic amendment mix, which contains:
earthworm castings
Espoma tomato-tone 3-4-6, with 8% ca, 1% mg + Bacillus and humic acid
Mix #2
33% new inorganic
17% biochar precharged with masterblend
33% recycled substrate containing 1/4 used up organics and 3/4 inorganic drainage component
earthworm castings
Whitney Farms tomato and vegetable food 7-6-9, with 6% ca, 1% mg
Mix #3
24% new inorganic
40% biochar pre-charged with masterblend
24% recycled substrate containing 1/4 used up organics and 3/4 inorganic drainage component
12% composted organics + organic amendment mix, which contains 1/3 of each above to balance differences
Mix #4
16% new inorganic
60% biochar pre-charged with masterblend
16% recycled substrate containing 1/4 used up organics and 3/4 inorganic drainage component
8% composted organics + organic amendment mix, which contains 1/3 of each above to balance differences
Mix #5
100% biochar
Testing Results
Potted June 2025. Two weeks dry. First watering included kelp + humic solution. Resume normal Masterblend fertilization schedule of around 3-5 applications at around 1900ec, then one flush with either hose water or Recharge. Random occasional foliar application of Jones Juice or Dune Si.
Test 1
Conducted after return from a 1 month trip away during which caretaker watered with only hose water.
Control – 1500, 7.7pH
Espoma 1050, 7.6pH
Whitney – 1150, 7.6pH
40% – 1300, 7.8pH
60% – 900, 7.6pH
100% – 300, 7.6pH
Tèst 2 – 8/7
The two waterings before this test were regular fertilization applications.
Control – 1300, 7.3pH
Espoma – 1300, 7.3pH
Whitney – 620, 7.2pH
40% – 1700, 7.3pH
60% – 2000, 7.3pH
100% – 2300, 7.5pH
Test 3 – 9/8
Previous few waterings were regular fertilizer applications.
Control – 1674
Espoma – 1590
Whitney – 1384
40% – 890
60% – 1682
100% – 2260
Test 4 – 10/12
Previous watering was a regular fertilization, before that substrate had been thoroughly flushed.
Base Water – 552, 8.4pH
Control – 960, 7.4pH
Espoma – 1474, 7.4pH
Whitney – 1702, 7.6pH
40% – 1658, 7.6H
60% – 1656, 7.6pH
100% – 1302, 7.6pH
Test 5 – 11/20
Sudden heavy burst of rain mid test resulted in an incomplete test.
Base Water 474, 8.3pH
Espoma – 628, 7.6pH
Whitney – 1120, 7.5pH
60% – 628, 7.7pH
Test 6 – 2/1
Later in winter, pots had been exposed to temps in mid 30s to 60 and rainfall without fertilization for a few months. Pots pre watered before pouring through hose water for test.
Base Water – 413
Control – 485
Espoma – 451
Whitney – 495
40% – 465
60% – 465
100% – 405
Test 7 – 3/21
Previous watering at strong feed of 3300 ec. Before that, thoroughly flushed via being rained on a few times. Pouring fert solution through for testing runoff collection.
Water – 500ec, 7ph
Solution – 3000ec 6.3ph
Control – 2538ec, 6.3pH
Espoma – 2298ec, 6.3pH
Whitney – 2598ec, 6.3pH
40% – 2322ec, 6.6pH
60% – 2319ec, 6.3pH
100% – 1554ec, 6.6pH
Other notes
Drying speed analysis: Control, Espoma, Whitney faster than 40,60,100 by tiny margin, but all fairly similar. The 60% and 100% require almost double the amount of liquid to achieve runoff vs the other substrates indicating extremely high porosity.
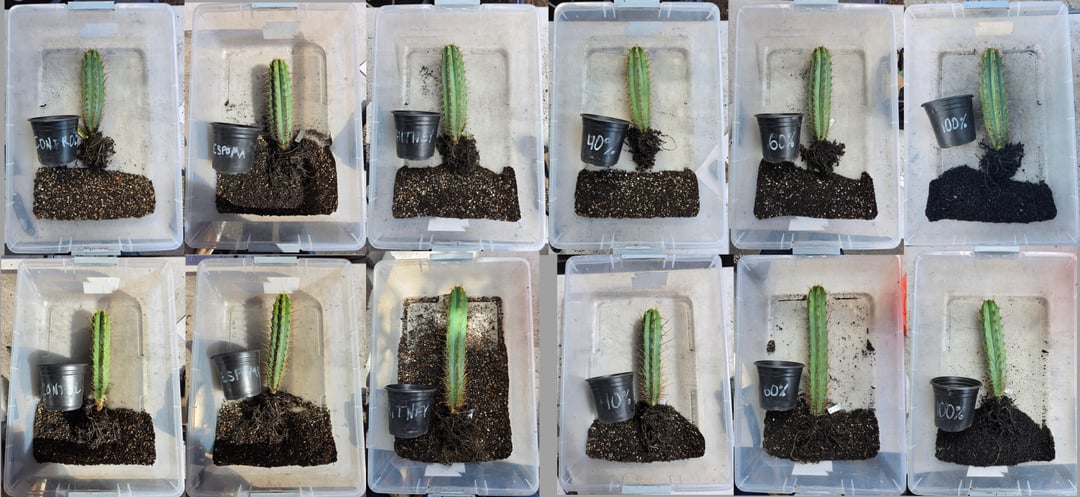
Unpotted ~ 4/25 for Root analysis. See photo 2
100% roots least developed, media fairly compact yet low density.
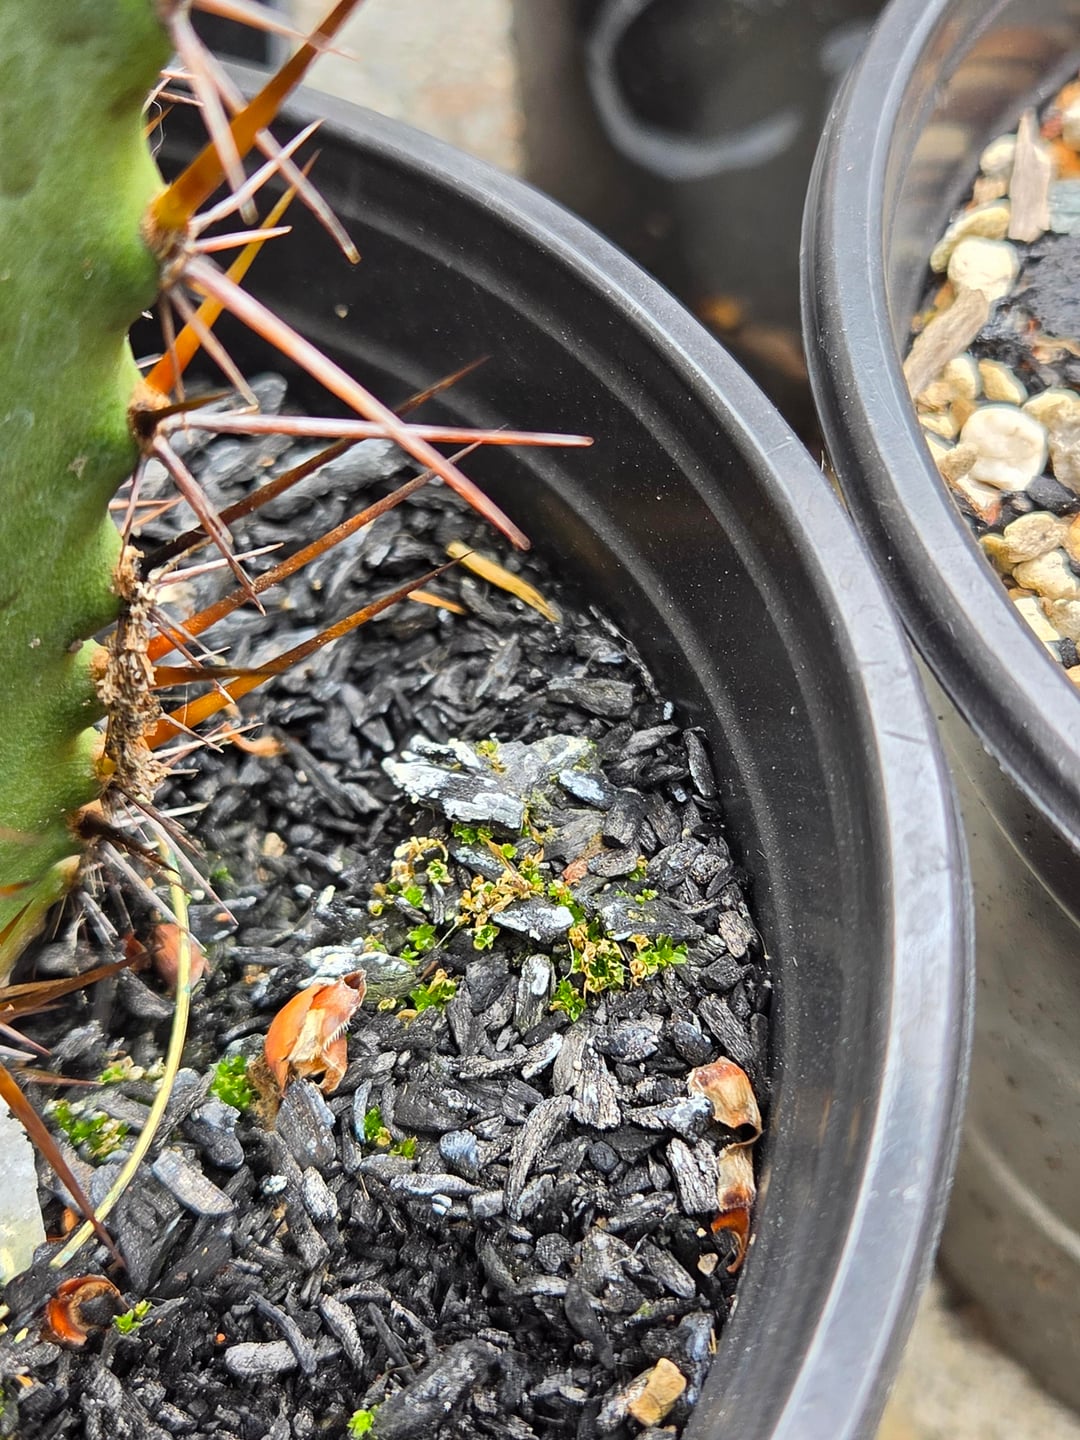
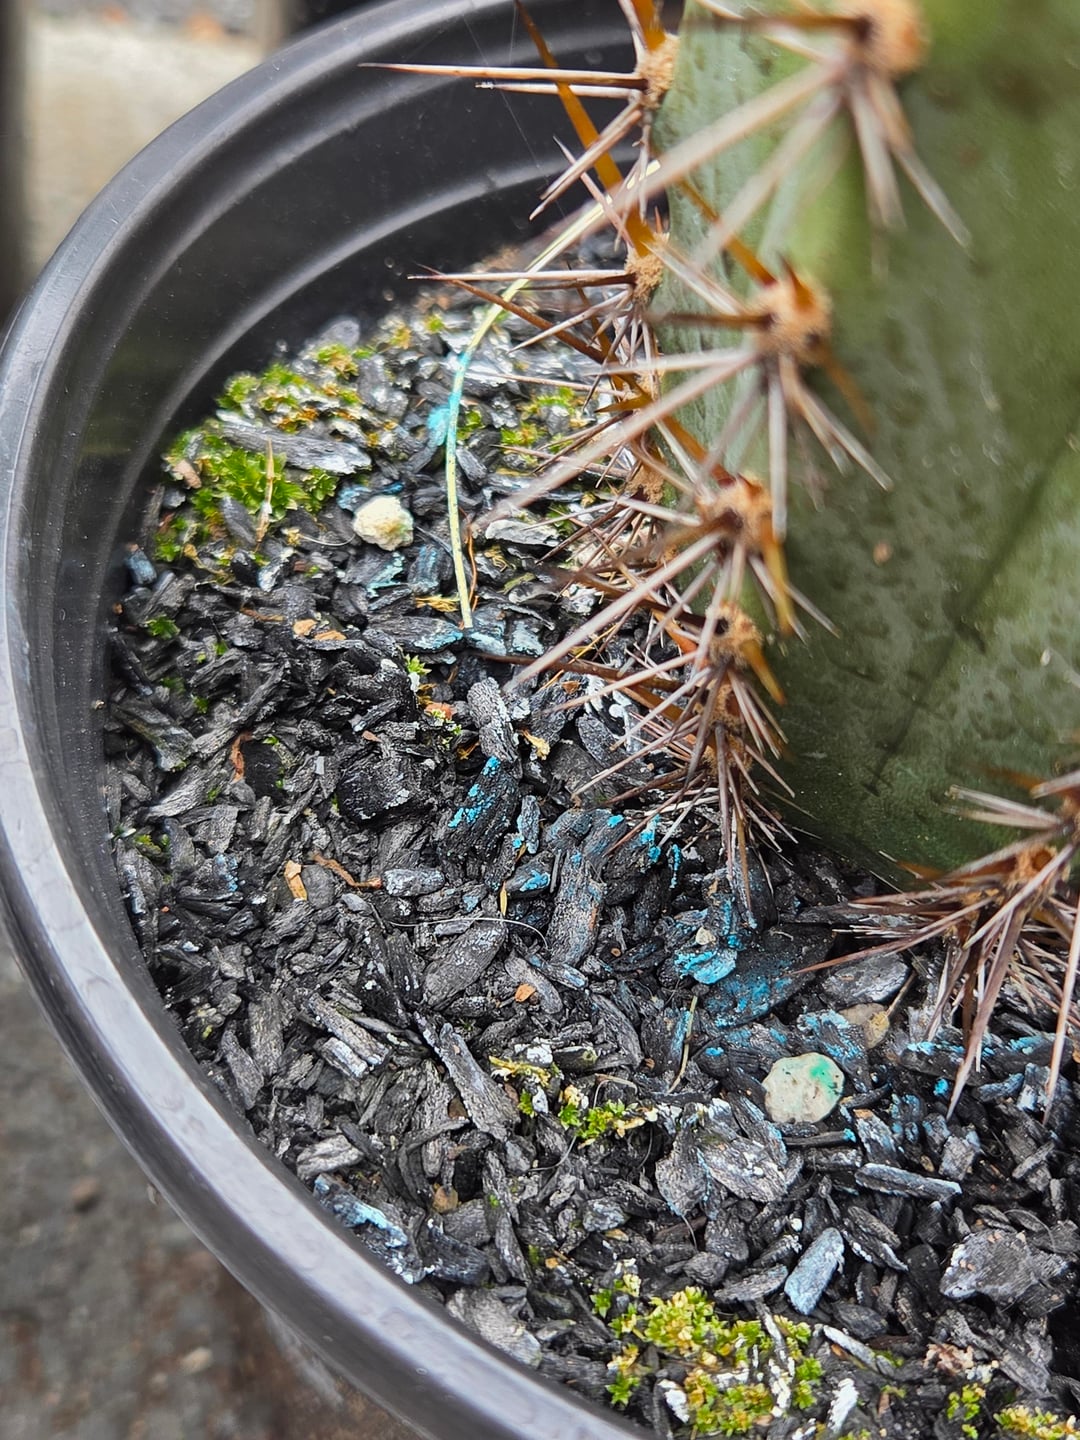
Clear evidence of microbial activity as well as some moss on surface of 100%, visible in photos 3 and 4.
Most developed roots award goes to Whitney. Rest of substrates within normal expected tolerance to control.
No pots had notable particle migration, an issue that was present in low quality mixes tested in previous years.
Springtails spotted in 40%, 60%, 100%
Dark tinted spines on 60%, 100%
Conclusions
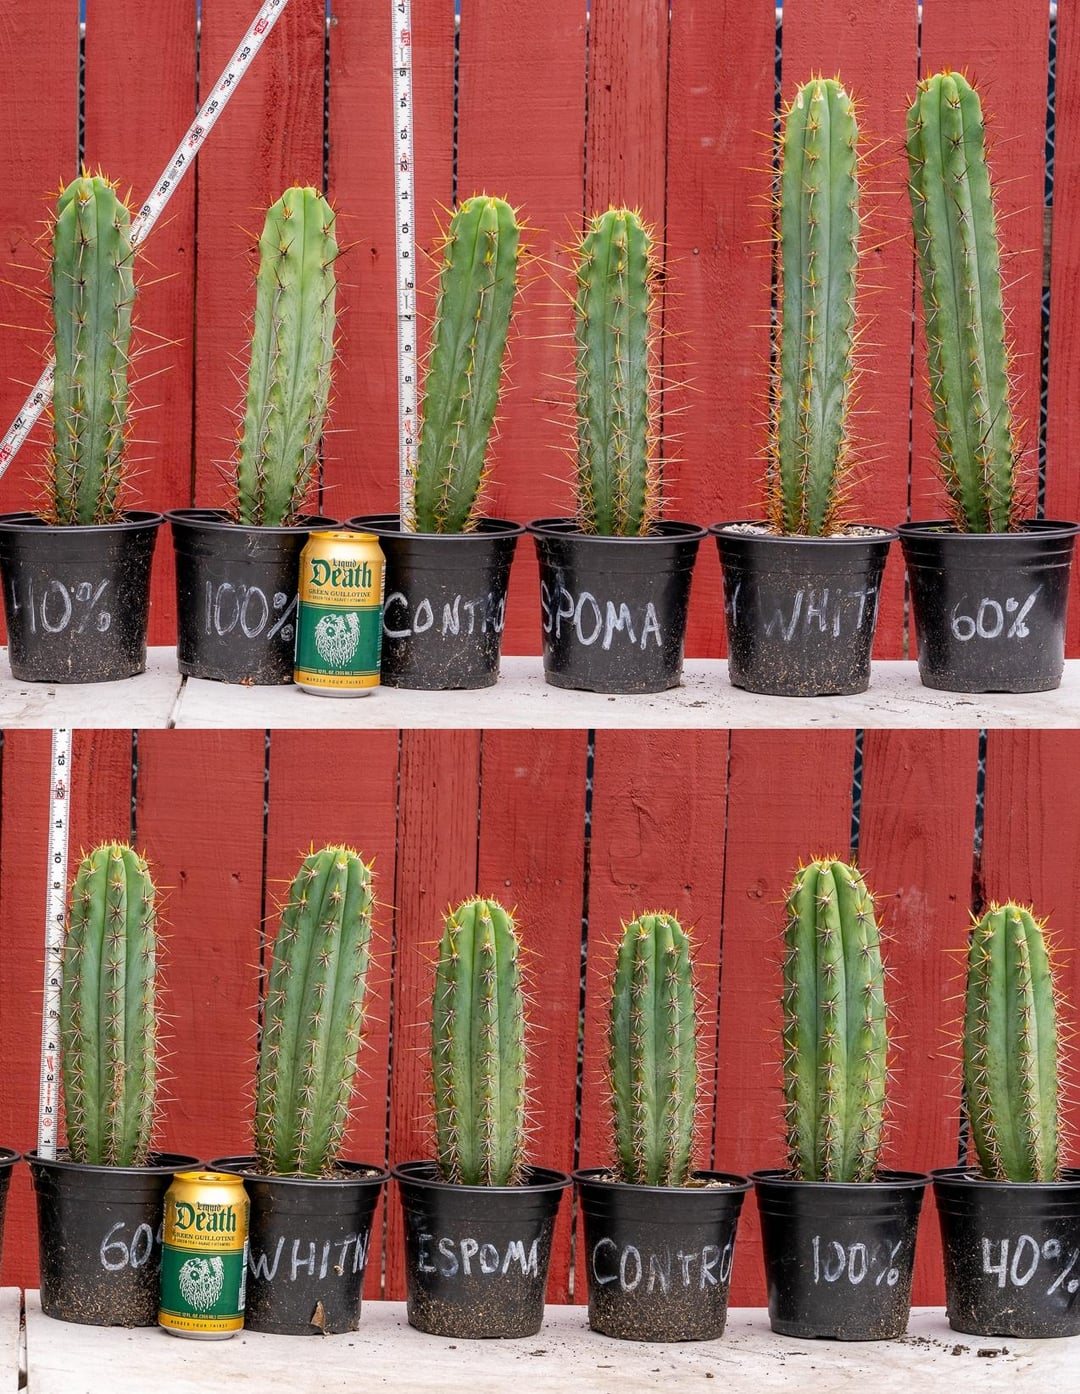
First of all, white paint marker on the side of black plastic pots holds up way better than sharpie on the white plastic labels. Pleasantly surprised by this as a method.
Amendments – The Whitney Farms Tomato and vegetable food and Espoma tomato tone amendments were tested as an alternative to purchasing a number of rather expensive individual ingredients that had to be individually measured out and applied to each tub of mixed soil I produced. The Whitney farms amendment was sold in Walmart very cheaply! Seems to be something special with this one, as I would say aside from a couple outlying test results it performed the best out of all test substrates. I went back this week to buy more and it is no longer sold by my walmart and the price of it on amazon is significantly higher per volume than I originally purchased it at. The Espoma tomato tone seems to be the wrong product. While there are many organic amendment product choices sold with varying names and labels, I should have chosen the Espoma citrus tone which has the same NPK as the whitney farms which is closer to my target NPK goal. I wanted to test the Citris tone because I have a friend that has success with it and the price isnt bad, but it wasnt available locally at time of setting up the experiment. Going forward I am going to test the Espoma citrus tone, I believe it may match the performance of the Whitney farms tomato and vegetable food and the citrus tone is sold in a 27 pound bag at a much better value than any of the tested products.
Biochar – There is a lot to unpack here. I think for the sake of full understanding of these results and educated discussion that we first need to talk a little about biochar – what it is, how its made, what its for, and the differences between regular char vs biochar. Then we can use that base to unpack the findings of my test.
Biochar is hard wood that is heated to very high temperatures in the absence of oxygen. When no oxygen is present there is no combustion and through a process called pyrolysis the organic matter decomposes into carbon which forms an extremely porous crystalline structure that is chemically stable. It has high water and nutrient retention properties facilitated by its extreme porosity and ionic magnetism while allowing drainage without clogging if fines are sifted out due to consistent particle size and particles that do not naturally break down into smaller fines without mechanical damage. The high porosity also aids beneficial microbial life and mycorrhizal fungi flourishing. True biochar that is created with pyrolysis will be entirely crystalline carbon through and through, black in color through and through, with a brittle nature, easily snapping with a clean break. It should have no smell and a pH of around 8-10.
Next, Char. Some people recently have been burning wood and adding this to their soil mixes. This produces Char, not Biochar. How is this different, how can we tell them apart, and what differences should be expected? When wood is burned in an environment that has limited oxygen, for example in a dug hole in the ground, it is transformed through a mixture of pyrolysis and combustion. The combustion occurs because oxygen is present. Combustion allows the Carbon in the wood to be released into CO and CO2, and the lower temperatures result in some of the organics being left behind as tars and resins. There may be white ash on the outside of the particles which are the mineral structure left behind when the carbon is burned away, there may be woody untransformed centers in larger particles, and there will be resins and tars trapped in the pores of the converted carbon that is present. The resins and tars may leave it smelling a bit piney or smokey. It is by nature going to have lower porosity, lower water retention, higher pH, higher density, and lower durability breaking down into fines much easier.
One thing that Biochar and Char share in common is that if added to a substrate with no preparation they will absorb nutrients from feed solutions or nutrients from other soil components with their ionic magnetism initially until they reach capacity, resulting in less nutrients running off, though roots and myco are supposedly still able to access the nutrients while they are stored in the pores of the material. Due to this, it is standard practice to precharge by soaking in a nutrient solution to fill the pores before mixing into a substrate. In addition to this property, Char specifically eats up high amounts of nitrogen for a while when its fresh in a mix in the process that the tars and resins created by combustion and trapped in the crystalline structure break down and decompose. This can result in significant stunting of plants for months after potting into a mix containing fresh char.
Moving on to impacts of varying levels of biochar in these test results. We can clearly see that with increasing levels of biochar, nutrient levels drop more with a flush, build higher after repeat fertilizations, and take more than one fertilization application to return to full charge. In my opinion this is not ideal. I really want something that grabs nutrients out of feed solution and holds on to it, releasing it more slowly over time rather than all at once with first non feed solution flush. It soaked up a ton of water and held on to it longer than control, but not so long as to be any issue, it still dries faster than perlite, for example. The density of the 100% mix was low, leaving the pot a bit easy to tip, but the 60% mix density was fine. Im not sure what lead to the reduced root development in the 100% but it is a problem. The boost to microbial life was very apparent. One other odd and unexpected thing to note was that the spines of the cacti in the 100% and 60% took a particularly dark, even black tint. Is the plant absorbing the carbon?
The high pH of the mix through most of the year is a concern. My soils already test high in sulphur, adding more is not something I want to do. The biochar absolutely raises pH into a range where some nutrients are less available at these quantities.
I decided to use and test biochar in this test because my local landscape supply yard started carrying it at a very affordable price ($10/cf). Precharging it was work. After analyzing these results I would say it is best in small quantities, that its very, very optional, and debatable if its good to add at all. Perhaps best if your other soil components are a little too acidic and you need to raise pH a little. I plan on continuing to add it to my mixes until I use up what I have but at a reduced rate than the standard recipe last year – reducing from 17% to maybe 5%. I would absolutely not recommend paying high prices per volume for this as some fancy addition.
One more thing: do your own testing! These results are extremely specific to my plants in my climate with the products I use in half gallon black plastic pots. Your results could be totally different! The more people's tests we see the better big picture we can draw! Hope to see more people publishing tests out there, even basic ones.
Thats it folks, thanks for reading! Let me know if you see any patterns I did not detect in my results or if there is anything else you might want to discuss on this topic.
by Vaugith
5 Comments
Very nice experiment. I’ve been using 5% charged bio char in all of my up pots for about the past year with good results, zone 10a. I was going to test higher amounts but it’s just too expensive from the local soil place near me for the amount I would need. Cool to see your results, great work.
Very thorough! Thanks for sharing.
My take is that comparing with cutting that are genetically identical would be better 🙂
You the goat, thank you for your work 👍
Thanks for this! This has been the highlight of my day 🙏
New to your contributions. What all do you use your control soil with?