

Injury diagnosis results: Because rockery has a long history and monitoring data before 2021 are missing, this study adopts the inverse inference method that links the damage status with the disease causes and deduces the leading disease causes of rockery cracks by combining historical literature information and the damage status. Figure 18 marks the specific locations of the 14 cracks of the SRMA.
Fig. 18: Structural crack location marking.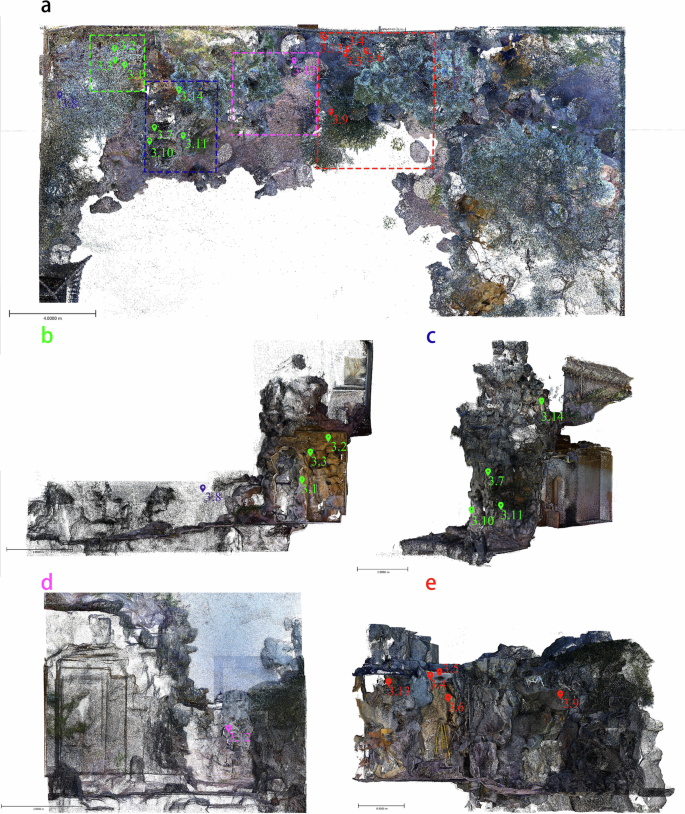
a Plane location marking of structural crack of SRMA. b Location of cracks in the west side cavern. c Location of cracks in the west main peak. d Location of cracks from the main peak east to central area. e Location of cracks in central cavern.
Stress cracks mainly cause structural cracks in the western zone. According to the damage survey, the obvious structural cracks in the western zone of the SRMA are on the west side of the cavern roof and the pillar of the cave entrance, and the obvious structural cracks in the west main peak are concentrated on the two sides. According to the static analysis results, the maximum peak value of the principal stress was 1.99E + 05 Pa, which was located in the middle of the entrance pillar of the west-side cavern, ~1.5 m from the foundation. The maximum principal strain peak was 3.66E−06 Pa and was located on the west side of the main peak, west central, ~1.25 m from the foundation. In the field investigation of structural cracks in the western zone of the SRMA, there were three structural cracks numbered 3.1, 3.2, and 3.3, in the west side cavern, and two cracks numbered 3.7 and 3.10 in the western part of the main peak. There is a crack numbered 3.11 at the base of the eastern part of the main peak, and a crack numbered 3.14 at the base of the rock at the summit of the main peak, consistent with the stress concentration area in the static analysis results.
Stress cracks and local settlement of the foundation mainly cause structural cracks in the central cavern. According to field investigations, the central cavern has noticeable structural cracks, which are mainly located at the top of the central cavern and the corner of the interior wall. According to the investigation status of crack Nos. 3.4, 3.5, 3.9, and 3.13 structural cracks leading to diseases caused by stress concentration, the bottom of the rockery is completely constrained, subject to self-weight load static analysis and simulation. The main cause of crack No. 3.6 was inferred to be the local settlement of the foundation. Therefore, based on the crack location obtained from the current investigation, the displacement area of the rockery foundation was inferred, and the vertical displacement was set in the local settlement area of the foundation for the static analysis and simulation. The static analysis revealed that under the condition of full constraint of the foundation, the structure of the central cavern is relatively stable, with the maximum principal stress and maximum principal strain located at the top of the west entrance of the central cavern, ~2.2 m from the foundation. The peak of principal stress is 2.55E + 05 Pa, and the peak of principal strain is 3.21E−06 Pa, which is consistent with crack number 3.5; the stress concentration area is consistent with crack numbers 3.4 and 3.13. Through historical literature and on-site damage investigations, it can be inferred that a local foundation settlement exists in this area. However, under a complete foundation constraint, the location of the most serious crack, 3.6 in this area, showed no obvious damage. Therefore, the location of local foundation settlement can be inferred by setting the local displacement in the direction of U3 (U3 = −0.12 m). After several numerical simulations, the stress concentration area was consistent with the positions 3.5, 3.6, and 3.9 of the current investigation. The peak position of the principal stress and principal strain is close to crack No. 3.6, located in the inner wall of the east exit of the central cavern, about 0.6 m away from the foundation. The peak values of the principal stress and principal strain were 4.58E + 06 Pa, and the peak value of the principal strain is 5.92E−03 Pa. Peak value of principal stress \({\sigma }_{\max }\) reaches the critical value of maximum principal stress \({\sigma }_{{\rm{c}}}\). Therefore, the main causes of the three cracks were determined to be the local settlement of the foundation and the general settlement region.
Stress cracks primarily caused the structural cracks from the main peak east to the central area. According to the static analysis results with full constraint at the bottom, the peak position of the principal stress is consistent with the crack No. 3.12, which is located from the peak of the main peak on the west side to the lower step of the central cavern, ~3.6 m away from the foundation. The maximum peak of the principal stress is 8.42E + 04 Pa.
Based on the finite element static simulation of 14 structural cracks in the SRMA, the main causes were determined and summarized. In the western zone, stress concentration was the leading cause of the seven cracks observed in the field investigation. From the main peak east to the central area, the stress concentration mainly caused one structural crack. Among the five structural cracks in the central cavern, crack Nos. 3.4, 3.5, and 3.13 were the main causes of stress concentration, while crack Nos 3.5, 3.6, and 3.9 were the main causes of local foundation settlement. In addition, there was another crack in the western area near the courtyard wall due to plant root cleavage by on-site damage investigation.
Cracking prediction results: A complete rockery in the central cavern was generated from the point cloud data obtained in 2021, and the cracking mode of the complete rockery model under local settlement was obtained using LEFM numerical simulation. The cracking stages of the rockery were divided according to the STATUSXFEM in Abaqus visualization results, combined with the crack size changes. When 0 < STATUSXFEM < 1, the rock is in the crack initiation stage. At this time, the maximum principal stress reaches the value of the crack initiation stress. When STATUSXFEM = 1, the crack passes through the first element. A change in the crack growth rate can be observed through the linear relationship between the steps and the crack size. In this process, cracks developed to a certain extent, the area no longer changed (1.844 m2), and the volume and displacement increased sharply until the collapse of the rock. According to the observation of the cracking mode of the central cavern under the condition of local settlement, the crack initiated vertically upward from the corner of the central cavern 1.2 m from the ground, slowly expanded to the entrance roof of the west side of the central cavern, and then entered the rapid expansion stage. The crack ran through the roof of the rockery and downward along the corner of the cave until it ran through the rock. Subsequently, the crack volume continued to increase rapidly until the crack growth was completed in Abaqus. The crack initiation position and expansion path of the central cavern were consistent with crack number 3.6. It was preliminarily determined that crack 3.6 was in the stage of slow crack expansion, and the crack size was also the largest. Therefore, the cracks were used for further numerical simulations of the crack expansion path.
Risk threshold and levels: In this study, the classification of crack risk level is mainly based on the SIF of Mode I crack, which is determined by solving the ratio \(R\) of Mode I crack fracture toughness \({K}_{{\rm{I}}}\) to its inherent fracture toughness \({K}_{{\rm{I}}{\rm{C}}}\). To verify the rationality of the risk level classification, a linear relationship between steps and crack size change was used to verify the mutual verification. The risk levels of each stage of crack No. 3.6 and the corresponding risk thresholds were obtained by calculation. The current area of crack No. 3.6 is 0.533 m². At Risk Level I, crack areas range from 0 to 1.571 m², with a critical crack area of 1.571 m², and a corresponding critical vertical displacement of −0.55 mm. When both the critical crack area and the critical vertical displacement are reached, the risk level escalates from Level I (Low Risk) to Level II (Moderate Risk). Therefore, the current crack No. 3.6 remains within Level I. When the crack size reaches 2.136 m² and the vertical displacement is −1.27 mm, the crack will enter Level III (High Risk). When the crack size reached 2.256 m², the crack area did not expand further, and the volume continued to expand until the rockery collapsed completely. However, because the rock material discussed is brittle limestone, it is necessary to focus on the changes in the initial stage of crack development, stages Level I to Level II, because the crack will expand rapidly after reaching Level III.
At Level I (Low Risk), the linear relationship between the steps and crack size showed that the crack growth was relatively slow, and the vertical displacement did not change significantly.
In Level II (Moderate Risk), the change in crack growth increased, and the change in the vertical displacement remained weak.
At Level III (High Risk), the crack area did not change after reaching 2.256 m2, indicating that the crack had penetrated the rockery. At this time, the vertical displacement changed significantly, from −1.27 to −122.45 mm, and the crack volume increased sharply, from 0.0007 to 0.0708 m3, until the crack development ended.
Dynamic preventive protection monitoring: Crack development in the central cavern is at a low risk. Therefore, future monitoring should focus on the local settlement of the rockery in the SRMA and changes in crack size. The results of the vertical displacement changes at special points in the central cavern obtained by numerical simulation and the change in crack growth size can be mutually verified to guide protection measures at different stages. For effective preventive protection, attention should be given to the transition from Level I to Level II, particularly the dynamic monitoring of the change in crack size. Because the change in vertical displacement is minimal, combining high-precision settlement monitoring technology is necessary. There are currently some limitations for dynamic monitoring. This study proposes a research method for determining the crack propagation risk threshold of classical garden rockeries. Point cloud data collected from the SRMA rockery in 2021 were used to generate the initial calculation results. A second round of data collection was conducted in February 2025 to preliminarily validate these results. However, no dynamic monitoring was performed during the intervening period, resulting in a lack of coherent point cloud data for this rockery. Therefore, following the establishment of quantitative risk levels and thresholds, future studies should incorporate regular dynamic monitoring to track temporal changes in relevant parameters. In addition to the incomplete collection of historical point cloud data, another limitation is that structural crack monitoring in this study primarily relied on on-site damage investigation and 3D model reconstruction based on point cloud data. In future work, information technologies for identifying crack features within 3D models45, combined with historical point cloud comparison techniques, could enable dynamic monitoring of crack size changes at a finer scale.
Compared with existing risk assessment methods for rockeries, no literature to date has adopted a similar approach to evaluate the crack propagation risk in classical garden rockeries. Therefore, this study is methodologically innovative. This study introduces LEFM, which is suitable for analyzing the fracture behavior of typical brittle materials, to the risk assessment of classical garden rockery structures. A voxel-based finite element modeling approach is employed, which yields comparable results to other equivalent finite element methods but offers superior computational efficiency46,47. Furthermore, the application of XFEM to numerically simulate structural damage in cultural heritage rockeries addresses a critical gap in the risk analysis of crack propagation in such structures. Therefore, compared with existing approaches, this study integrates rock fracture mechanics theory and the extended finite element method into the risk assessment of cultural heritage rockeries. It provides a practical and engineering-oriented method that simplifies finite element modeling and improves operational efficiency. Future research may further explore ways to better balance prediction accuracy and computational performance. To further illustrate its practical value, the specific advantages of this method are summarized as follows.
The leading causes of structural cracks in the rockery were identified through mechanical analysis. During the damage investigation stage, the location, length, width, depth, and probable causes of each crack can be determined based on historical literature and on-site inspection. Through the static analysis process of preliminary damage diagnosis, non-structural cracks can be effectively excluded, incorrect causal attributions can be corrected, potential crack initiation points can be identified, and objective damage diagnosis reports for each structural crack can be produced. These methods are effective for identifying key monitoring areas and guiding preventive protection strategies. For instance, if structural cracks are caused by local foundation settlement, it is essential to regularly monitor foundation displacement trends and associated crack size variations. If structural cracks result from tourist loads, it becomes necessary to manage the number and frequency of tourists climbing on the rockeries.
The rockery’s crack mode and crack growth path were predicted using LEFM. The cracking mode of the rockery, as determined through LEFM numerical simulation, can be cross-validated with the crack damage diagnosis report to further identify the primary cause of each crack. For instance, under conditions of local foundation settlement, the crack pattern observed in the central cavern corresponds to crack No. 3.6. This supports the conclusion that local settlement is the primary cause of cracking in this area. Based on this finding, the risk threshold for crack No. 3.6 was calculated to provide an objective basis for evaluating its structural risk.
The risk threshold, risk level, and preventive protection strategy against rock cracks were determined effectively. In this study, He Garden was used as a case study to implement the full workflow of damage investigation and data processing, leading to the generation of a structural crack diagnosis report for the rockery. The extended finite element method was applied to simulate the rockery’s crack propagation mode and predict the crack growth path. As a result, the crack risk levels and risk thresholds at each stage were determined, demonstrating the feasibility of this numerical simulation system for assessing crack development risk in cultural heritage rockeries. This system offers an objective reference for guiding the preventive protection of rockeries with significant structural cracking.
To develop a comprehensive crack propagation risk assessment system, future studies should consider incorporating a broader set of influencing factors. The classification of crack risk level was primarily based on the ratio (\(R\)) of the Mode I SIF \({K}_{I}\) to the material’s inherent fracture toughness \({K}_{IC}\). This study conducts numerical simulations on rockeries exhibiting prominent structural risk cracks. In future research, a plastic constitutive model may be introduced to evaluate rockeries with broader potential risks. For instance, studying the plastic zones of rockeries can help simulate structural instability in the overall rockery. In addition to load-induced stress, factors such as high temperature48 and water infiltration49 may also contribute to structural degradation. These elements may induce coupled damage mechanisms50, therefore, numerical modeling incorporating multi-field coupling can be developed to further assess the crack propagation risks in cultural heritage rockeries. While this study focuses solely on crack propagation risk in terms of structural stability, it does not address the impact of crack development on aesthetic qualities. Future research could examine the relationship between crack spatial distribution and garden visual corridors using visual domain analysis tools.
The experimental results indicate that the transition from Risk Level I to Risk Level II in crack propagation warrants particular attention. The fracture toughness of brittle rock materials increases sharply as cracking progresses and exhibits significant variation with displacement, crack size, and related parameters. The low and moderate risk stages constitute only a small portion of the entire crack development process. During this phase, displacement changes are minimal, while the crack area expands slowly at first and then continuously, eventually stabilizing. Once the crack enters the high-risk stage, it gradually penetrates the rockery, with a sharp increase in displacement and a rapid rise in crack volume. This behavior aligns with the crack propagation characteristics of brittle rocks under linear elastic fracture mechanics and the damage evolution laws of limestone. Therefore, for effective dynamic monitoring and preventive protection of crack propagation in rockeries, close attention should be paid to variations in key deterioration indicators during both the initial and stable propagation stages to prevent the formation of through-cracks. This approach holds practical engineering significance for rock monitoring and the preservation of cultural heritage.
Comments are closed.