

Feb 20, 2026
IndexBox has just published a new report: EU – Garden Tools – Market Analysis, Forecast, Size, Trends And Insights.
The EU garden tools market is forecast for modest growth, with volume expected to reach 46K tons (CAGR +0.7%) and value to hit $417M (CAGR +1.4%) by 2035. In 2024, consumption was 42K tons valued at $358M, led by Germany, Italy, and Spain. EU production declined to 36K tons, while imports rose to 27K tons and exports fell to 21K tons. Key trends include Ireland’s strong consumption growth, the Czech Republic’s rising production, and significant intra-EU trade variations in price and volume among member states.
Key Findings
EU garden tools market forecast to grow to 46K tons ($417M) by 2035 with modest CAGRs of +0.7% in volume and +1.4% in valueGermany, Italy, and Spain are the largest consuming nations, together accounting for 53% of total market volumeEU production is in decline, falling to 36K tons in 2024, creating a supply gap filled by importsIntra-EU trade is significant, with Germany, the Netherlands, and France as top importers, and Germany, the Netherlands, and Poland as leading exportersNotable price disparities exist in trade, with Austrian import prices over triple those of Greece, and French export prices being the highestMarket Forecast
Driven by rising demand for garden tool in the European Union, the market is expected to start an upward consumption trend over the next decade. The performance of the market is forecast to increase slightly, with an anticipated CAGR of +0.7% for the period from 2024 to 2035, which is projected to bring the market volume to 46K tons by the end of 2035.
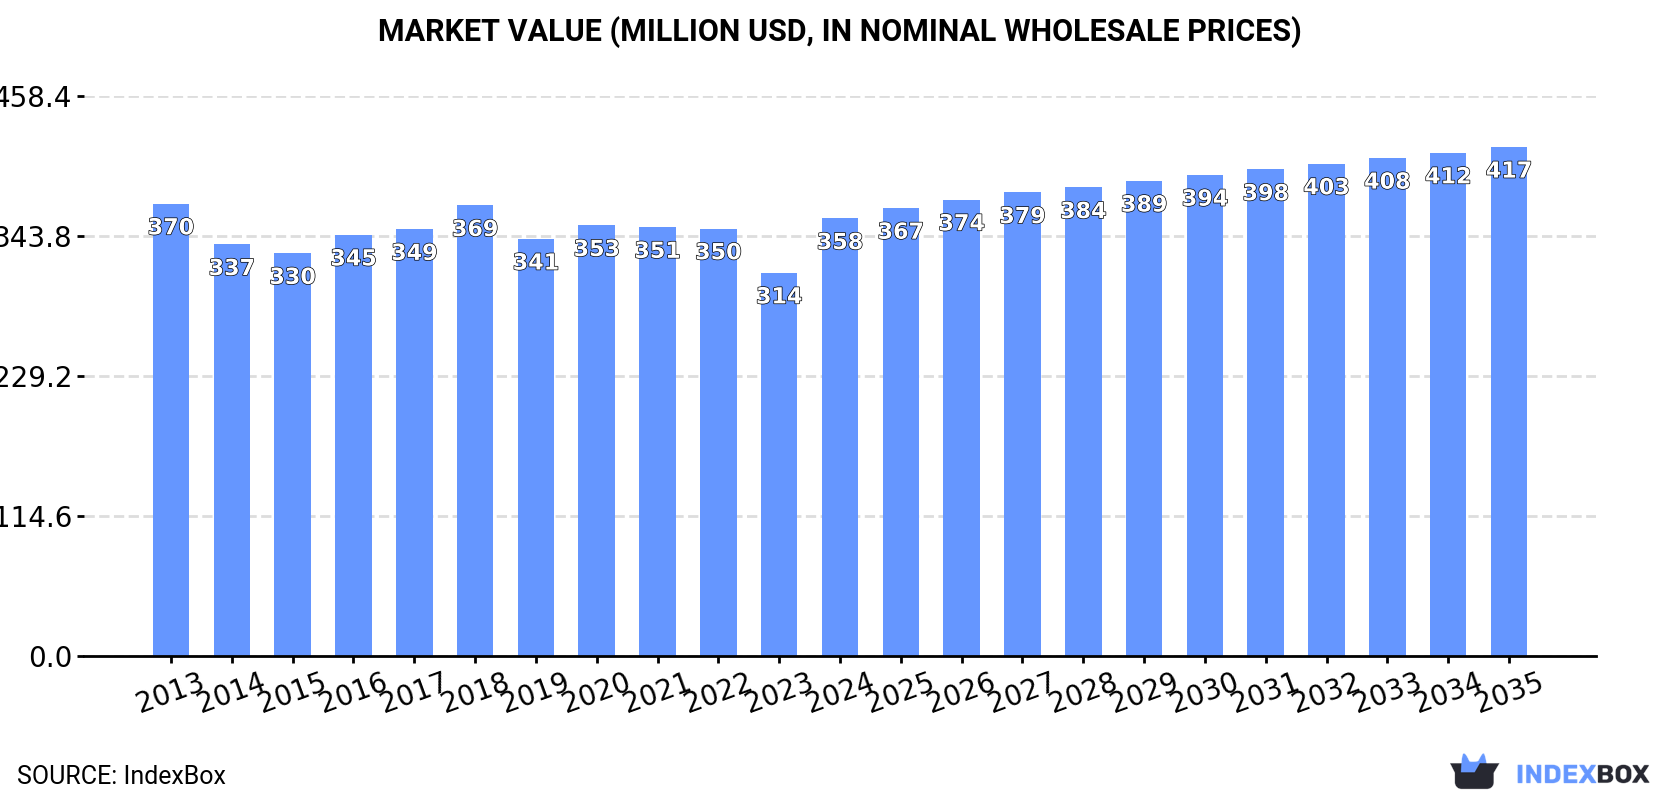
In value terms, the market is forecast to increase with an anticipated CAGR of +1.4% for the period from 2024 to 2035, which is projected to bring the market value to $417M (in nominal wholesale prices) by the end of 2035.
 ConsumptionEuropean Union’s Consumption of Garden Tools
In 2024, the amount of garden tools consumed in the European Union rose slightly to 42K tons, picking up by 4.9% compared with 2023 figures. In general, consumption, however, recorded a mild descent. The growth pace was the most rapid in 2022 when the consumption volume increased by 7% against the previous year. The volume of consumption peaked at 50K tons in 2016; however, from 2017 to 2024, consumption stood at a somewhat lower figure.
The value of the garden tool market in the European Union expanded remarkably to $358M in 2024, picking up by 14% against the previous year. This figure reflects the total revenues of producers and importers (excluding logistics costs, retail marketing costs, and retailers’ margins, which will be included in the final consumer price). Over the period under review, consumption, however, continues to indicate a relatively flat trend pattern. The level of consumption peaked at $370M in 2013; however, from 2014 to 2024, consumption stood at a somewhat lower figure.
Consumption By Country
The countries with the highest volumes of consumption in 2024 were Germany (11K tons), Italy (6.7K tons) and Spain (4.5K tons), with a combined 53% share of total consumption. Poland, France, the Netherlands, Belgium, the Czech Republic, Ireland and Sweden lagged somewhat behind, together accounting for a further 30%.
From 2013 to 2024, the biggest increases were recorded for Ireland (with a CAGR of +4.4%), while consumption for the other leaders experienced mixed trends in the consumption figures.
In value terms, Germany ($101M), Italy ($63M) and Spain ($32M) appeared to be the countries with the highest levels of market value in 2024, together comprising 55% of the total market. Poland, France, the Netherlands, Sweden, Belgium, the Czech Republic and Ireland lagged somewhat behind, together accounting for a further 31%.
Among the main consuming countries, Sweden, with a CAGR of +5.2%, recorded the highest growth rate of market size over the period under review, while market for the other leaders experienced more modest paces of growth.
The countries with the highest levels of garden tool per capita consumption in 2024 were Ireland (249 kg per 1000 persons), Germany (136 kg per 1000 persons) and Belgium (125 kg per 1000 persons).
From 2013 to 2024, the biggest increases were recorded for Ireland (with a CAGR of +3.4%), while consumption for the other leaders experienced a decline in the per capita consumption figures.
ProductionEuropean Union’s Production of Garden Tools
For the third year in a row, the European Union recorded decline in production of garden tools, which decreased by -5.5% to 36K tons in 2024. In general, production showed a relatively flat trend pattern. The pace of growth appeared the most rapid in 2017 when the production volume increased by 5.1% against the previous year. As a result, production reached the peak volume of 43K tons. From 2018 to 2024, production growth remained at a lower figure.
In value terms, garden tool production expanded markedly to $352M in 2024 estimated in export price. Overall, production, however, saw a relatively flat trend pattern. The level of production peaked at $363M in 2018; however, from 2019 to 2024, production stood at a somewhat lower figure.
Production By Country
The countries with the highest volumes of production in 2024 were Germany (11K tons), Italy (6.6K tons) and Poland (5.1K tons), with a combined 62% share of total production. Spain, the Czech Republic, France, Austria, the Netherlands, Bulgaria and Sweden lagged somewhat behind, together accounting for a further 31%.
From 2013 to 2024, the most notable rate of growth in terms of production, amongst the key producing countries, was attained by the Czech Republic (with a CAGR of +23.1%), while production for the other leaders experienced more modest paces of growth.
ImportsEuropean Union’s Imports of Garden Tools
In 2024, the amount of garden tools imported in the European Union expanded modestly to 27K tons, picking up by 3.1% compared with the previous year. Total imports indicated a perceptible expansion from 2013 to 2024: its volume increased at an average annual rate of +2.8% over the last eleven-year period. The trend pattern, however, indicated some noticeable fluctuations being recorded throughout the analyzed period. Based on 2024 figures, imports decreased by -21.2% against 2022 indices. The pace of growth appeared the most rapid in 2021 when imports increased by 20%. The volume of import peaked at 35K tons in 2022; however, from 2023 to 2024, imports failed to regain momentum.
In value terms, garden tool imports totaled $214M in 2024. Total imports indicated a tangible increase from 2013 to 2024: its value increased at an average annual rate of +4.7% over the last eleven-year period. The trend pattern, however, indicated some noticeable fluctuations being recorded throughout the analyzed period. Based on 2024 figures, imports decreased by -15.2% against 2021 indices. The pace of growth was the most pronounced in 2021 with an increase of 24% against the previous year. As a result, imports reached the peak of $252M. From 2022 to 2024, the growth of imports remained at a somewhat lower figure.
Imports By Country
The purchases of the nine major importers of garden tools, namely Germany, the Netherlands, Greece, Spain, France, Belgium, Ireland, Poland and Romania, represented more than two-thirds of total import. Austria (782 tons) followed a long way behind the leaders.
From 2013 to 2024, the biggest increases were recorded for Greece (with a CAGR of +14.8%), while purchases for the other leaders experienced more modest paces of growth.
In value terms, Germany ($48M), the Netherlands ($35M) and France ($19M) appeared to be the countries with the highest levels of imports in 2024, together comprising 48% of total imports. Belgium, Greece, Spain, Austria, Poland, Ireland and Romania lagged somewhat behind, together comprising a further 29%.
Greece, with a CAGR of +10.1%, saw the highest rates of growth with regard to the value of imports, among the main importing countries over the period under review, while purchases for the other leaders experienced more modest paces of growth.
Import Prices By Country
The import price in the European Union stood at $7,790 per ton in 2024, approximately equating the previous year. Over the period from 2013 to 2024, it increased at an average annual rate of +1.9%. The most prominent rate of growth was recorded in 2023 when the import price increased by 13% against the previous year. The level of import peaked at $8,306 per ton in 2021; however, from 2022 to 2024, import prices stood at a somewhat lower figure.
Prices varied noticeably by country of destination: amid the top importers, the country with the highest price was Austria ($12,429 per ton), while Greece ($3,745 per ton) was amongst the lowest.
From 2013 to 2024, the most notable rate of growth in terms of prices was attained by Poland (+3.7%), while the other leaders experienced more modest paces of growth.
ExportsEuropean Union’s Exports of Garden Tools
In 2024, overseas shipments of garden tools decreased by -13.3% to 21K tons, falling for the third year in a row after two years of growth. Total exports indicated a buoyant expansion from 2013 to 2024: its volume increased at an average annual rate of +5.0% over the last eleven years. The trend pattern, however, indicated some noticeable fluctuations being recorded throughout the analyzed period. Based on 2024 figures, exports decreased by -22.2% against 2021 indices. The most prominent rate of growth was recorded in 2021 with an increase of 34% against the previous year. As a result, the exports reached the peak of 28K tons. From 2022 to 2024, the growth of the exports failed to regain momentum.
In value terms, garden tool exports rose to $205M in 2024. Total exports indicated a strong increase from 2013 to 2024: its value increased at an average annual rate of +7.0% over the last eleven-year period. The trend pattern, however, indicated some noticeable fluctuations being recorded throughout the analyzed period. Based on 2024 figures, exports decreased by -13.5% against 2021 indices. The pace of growth was the most pronounced in 2021 with an increase of 37% against the previous year. As a result, the exports attained the peak of $237M. From 2022 to 2024, the growth of the exports remained at a lower figure.
Exports By Country
In 2024, Germany (4.6K tons), distantly followed by Poland (2.8K tons), the Netherlands (2.7K tons), Greece (2.7K tons), Spain (1.4K tons), the Czech Republic (1.3K tons) and France (1.1K tons) were the major exporters of garden tools, together committing 77% of total exports. The following exporters – Austria (941 tons), Bulgaria (899 tons) and Italy (651 tons) – together made up 12% of total exports.
From 2013 to 2024, the most notable rate of growth in terms of shipments, amongst the main exporting countries, was attained by Greece (with a CAGR of +26.9%), while the other leaders experienced more modest paces of growth.
In value terms, the largest garden tool supplying countries in the European Union were Germany ($44M), the Netherlands ($32M) and Poland ($28M), with a combined 51% share of total exports. Spain, the Czech Republic, France, Austria, Greece, Bulgaria and Italy lagged somewhat behind, together comprising a further 35%.
Among the main exporting countries, Bulgaria, with a CAGR of +25.2%, saw the highest growth rate of the value of exports, over the period under review, while shipments for the other leaders experienced more modest paces of growth.
Export Prices By Country
In 2024, the export price in the European Union amounted to $9,565 per ton, increasing by 21% against the previous year. Over the last eleven-year period, it increased at an average annual rate of +1.9%. As a result, the export price attained the peak level and is likely to continue growth in the immediate term.
There were significant differences in the average prices amongst the major exporting countries. In 2024, amid the top suppliers, the country with the highest price was France ($12,223 per ton), while Greece ($3,589 per ton) was amongst the lowest.
From 2013 to 2024, the most notable rate of growth in terms of prices was attained by the Netherlands (+6.3%), while the other leaders experienced more modest paces of growth.
Source: IndexBox Market Intelligence Platform
This report provides a comprehensive view of the garden tool industry in European Union, tracking demand, supply, and trade flows across the regional value chain. It explains how demand across key channels and end-use segments shapes consumption patterns, while also mapping the role of input availability, production efficiency, and regulatory standards on supply.
Beyond headline metrics, the study benchmarks prices, margins, and trade routes so you can see where value is created and how it moves between exporters and importers within European Union. The analysis is designed to support strategic planning, market entry, portfolio prioritization, and risk management in the garden tool landscape in European Union.
Quick navigation
Key findings
Regional demand is shaped by both household and industrial usage, with trade flows linking supply hubs to import-reliant countries.
Pricing dynamics reflect unit values, freight costs, exchange rates, and regulatory shifts that affect sourcing decisions.
Supply depends on input availability and production efficiency, creating distinct cost curves across European Union.
Market concentration varies by country, creating different competitive landscapes and entry barriers.
The 2035 outlook highlights where capacity investment and demand growth are most aligned within the region.
Report scope
The report combines market sizing with trade intelligence and price analytics for European Union. It covers both historical performance and the forward outlook to 2035, allowing you to compare cycles, structural shifts, and policy impacts across countries and sub-regions.
Market size and growth in value and volume terms
Consumption structure by end-use segments and countries
Production capacity, output, and cost dynamics
Regional trade flows, exporters, importers, and balances
Price benchmarks, unit values, and margin signals
Competitive context and market entry conditions
Product coverageProdcom 25731055 – Forks and other hand tools (excluding clasp knives) for agriculture, horticulture or forestryCountry coverageCountry profiles and benchmarks
For the regional report, country profiles provide a consistent view of market size, trade balance, prices, and per-capita indicators across European Union. The profiles highlight the largest consuming and producing markets and allow direct benchmarking across peers.
Methodology
The analysis is built on a multi-source framework that combines official statistics, trade records, company disclosures, and expert validation. Data are standardized, reconciled, and cross-checked to ensure consistency across time series.
International trade data (exports, imports, and mirror statistics)
National production and consumption statistics
Company-level information from financial filings and public releases
Price series and unit value benchmarks
Analyst review, outlier checks, and time-series validation
All data are normalized to a common product definition and mapped to a consistent set of codes. This ensures that comparisons across time are aligned and actionable.
Forecasts to 2035
The forecast horizon extends to 2035 and is based on a structured model that links garden tool demand and supply to macroeconomic indicators, trade patterns, and sector-specific drivers. The model captures both cyclical and structural factors and reflects known policy and technology shifts within European Union.
Historical baseline: 2012-2025
Forecast horizon: 2026-2035
Scenario-based sensitivity to income growth, substitution, and regulation
Capacity and investment outlook for major producing countries
Each country projection is built from its own historical pattern and the regional context, allowing the report to show where growth is concentrated and where risks are elevated.
Price analysis and trade dynamics
Prices are analyzed in detail, including export and import unit values, regional spreads, and changes in trade costs. The report highlights how seasonality, freight rates, exchange rates, and supply disruptions influence pricing and margins.
Price benchmarks by country and sub-region
Export and import unit value trends
Seasonality and calendar effects in trade flows
Price outlook to 2035 under baseline assumptions
Profiles of market participants
Key producers, exporters, and distributors are profiled with a focus on their operational scale, geographic footprint, product mix, and market positioning. This helps identify competitive pressure points, partnership opportunities, and routes to differentiation.
Business focus and production capabilities
Geographic reach and distribution networks
Cost structure and pricing strategy indicators
Compliance, certification, and sustainability context
How to use this report
Quantify regional demand and identify the most attractive country markets
Evaluate export opportunities and prioritize target destinations
Track price dynamics and protect margins
Benchmark performance against regional competitors
Build evidence-based forecasts for investment decisions
This report is designed for manufacturers, distributors, importers, wholesalers, investors, and advisors who need a clear, data-driven picture of garden tool dynamics in European Union.
FAQ
What is included in the garden tool market in European Union?
The market size aggregates consumption and trade data at country and sub-regional levels, presented in both value and volume terms.
How are the forecasts to 2035 built?
The projections combine historical trends with macroeconomic indicators, trade dynamics, and sector-specific drivers.
Does the report cover prices and margins?
Yes, it includes export and import unit values, regional spreads, and a pricing outlook to 2035.
Which countries are profiled in detail?
The report provides profiles for the largest consuming and producing countries in European Union.
Can this report support market entry decisions?
Yes, it highlights demand hotspots, trade routes, pricing trends, and competitive context.
Comments are closed.