

Feb 17, 2026
IndexBox has just published a new report: China – Garden Tools – Market Analysis, Forecast, Size, Trends And Insights.
The article provides a comprehensive analysis of China’s garden tools market. It forecasts growth to 106K tons (volume) and $475M (value) by 2035, driven by increasing domestic demand. In 2024, domestic consumption was 72K tons ($291M), while production was significantly higher at 104K tons ($438M), indicating a strong export-oriented industry. China is a net exporter, with 33K tons ($154M) shipped abroad, primarily to the United States. Imports are minimal (38 tons, $631K) but high-value, led by Thailand and Sweden. The market shows a trend of rising value per unit in both imports and exports.
Key Findings
China’s garden tool market is forecast to grow to 106K tons and $475M by 2035Domestic consumption in 2024 was 72K tons, while production was 104K tons, highlighting an export surplusThe United States is the primary export destination, receiving 27% of China’s garden tool exports by volumeImports are low in volume but high in value, with Sweden’s import price exceeding $526K per tonExport value growth (+5.8% CAGR 2013-2024) outpaces volume growth (+2.5%), indicating rising product valueMarket Forecast
Driven by increasing demand for garden tools in China, the market is expected to continue an upward consumption trend over the next decade. Market performance is forecast to accelerate, expanding with an anticipated CAGR of +3.6% for the period from 2024 to 2035, which is projected to bring the market volume to 106K tons by the end of 2035.
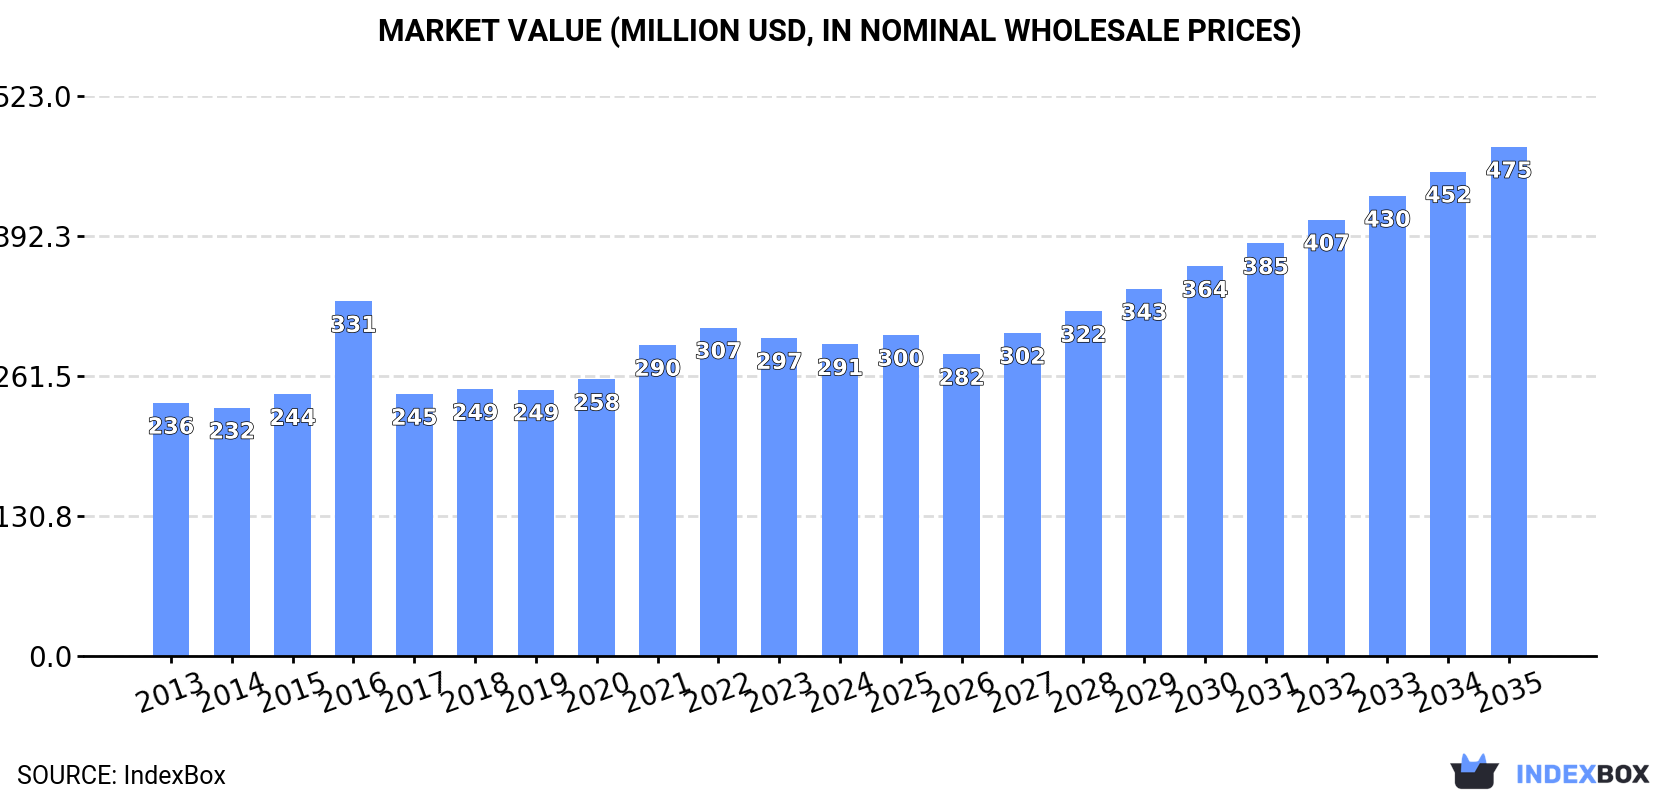
In value terms, the market is forecast to increase with an anticipated CAGR of +4.6% for the period from 2024 to 2035, which is projected to bring the market value to $475M (in nominal wholesale prices) by the end of 2035.
 ConsumptionChina’s Consumption of Garden Tools
In 2024, consumption of garden tools decreased by -0.7% to 72K tons, falling for the second consecutive year after three years of growth. Overall, consumption, however, continues to indicate a relatively flat trend pattern. The most prominent rate of growth was recorded in 2021 when the consumption volume increased by 6.8% against the previous year. Garden tool consumption peaked at 74K tons in 2022; however, from 2023 to 2024, consumption remained at a lower figure.
The size of the garden tool market in China reduced modestly to $291M in 2024, waning by -2% against the previous year. This figure reflects the total revenues of producers and importers (excluding logistics costs, retail marketing costs, and retailers’ margins, which will be included in the final consumer price). The market value increased at an average annual rate of +1.9% from 2013 to 2024; the trend pattern indicated some noticeable fluctuations being recorded throughout the analyzed period. As a result, consumption attained the peak level of $331M. From 2017 to 2024, the growth of the market remained at a somewhat lower figure.
ProductionChina’s Production of Garden Tools
After two years of decline, production of garden tools increased by 6.9% to 104K tons in 2024. The total output volume increased at an average annual rate of +1.4% from 2013 to 2024; the trend pattern remained consistent, with only minor fluctuations being observed in certain years. The most prominent rate of growth was recorded in 2017 when the production volume increased by 25% against the previous year. Over the period under review, production attained the peak volume at 105K tons in 2021; however, from 2022 to 2024, production remained at a lower figure.
In value terms, garden tool production expanded to $438M in 2024 estimated in export price. The total output value increased at an average annual rate of +2.9% over the period from 2013 to 2024; the trend pattern indicated some noticeable fluctuations being recorded throughout the analyzed period. The pace of growth appeared the most rapid in 2016 with an increase of 27% against the previous year. Garden tool production peaked at $448M in 2022; however, from 2023 to 2024, production remained at a lower figure.
ImportsChina’s Imports of Garden Tools
Garden tool imports into China declined to 38 tons in 2024, dropping by -13.9% on the previous year. In general, imports recorded a abrupt contraction. The most prominent rate of growth was recorded in 2016 when imports increased by 39%. Over the period under review, imports reached the peak figure at 109 tons in 2013; however, from 2014 to 2024, imports remained at a lower figure.
In value terms, garden tool imports reduced notably to $631K in 2024. Over the period under review, imports, however, saw notable growth. The growth pace was the most rapid in 2021 with an increase of 79%. Over the period under review, imports reached the peak figure at $944K in 2023, and then reduced remarkably in the following year.
Imports By Country
Thailand (12 tons), Taiwan (Chinese) (7.3 tons) and Germany (624 kg) were the main suppliers of garden tool imports to China, with a combined 52% share of total imports.
From 2013 to 2024, the biggest increases were recorded for Thailand (with a CAGR of +154.9%), while purchases for the other leaders experienced more modest paces of growth.
In value terms, Thailand ($358K) constituted the largest supplier of garden tools to China, comprising 57% of total imports. The second position in the ranking was taken by Sweden ($127K), with a 20% share of total imports. It was followed by the Netherlands, with a 5.2% share.
From 2013 to 2024, the average annual rate of growth in terms of value from Thailand stood at +191.8%. The remaining supplying countries recorded the following average annual rates of imports growth: Sweden (+3.0% per year) and the Netherlands (+25.1% per year).
Import Prices By Country
The average garden tool import price stood at $16,685 per ton in 2024, declining by -22.4% against the previous year. Over the period under review, the import price, however, posted a strong expansion. The pace of growth was the most pronounced in 2017 when the average import price increased by 129% against the previous year. Over the period under review, average import prices reached the peak figure at $22,577 per ton in 2021; however, from 2022 to 2024, import prices remained at a lower figure.
There were significant differences in the average prices amongst the major supplying countries. In 2024, amid the top importers, the country with the highest price was Sweden ($526,686 per ton), while the price for Taiwan (Chinese) ($3,457 per ton) was amongst the lowest.
From 2013 to 2024, the most notable rate of growth in terms of prices was attained by Russia (+43.8%), while the prices for the other major suppliers experienced more modest paces of growth.
ExportsChina’s Exports of Garden Tools
In 2024, overseas shipments of garden tools were finally on the rise to reach 33K tons for the first time since 2021, thus ending a two-year declining trend. In general, total exports indicated a pronounced increase from 2013 to 2024: its volume increased at an average annual rate of +2.5% over the last eleven years. The trend pattern, however, indicated some noticeable fluctuations being recorded throughout the analyzed period. The pace of growth was the most pronounced in 2017 with an increase of 161%. Over the period under review, the exports hit record highs at 33K tons in 2021; however, from 2022 to 2024, the exports failed to regain momentum.
In value terms, garden tool exports skyrocketed to $154M in 2024. Overall, total exports indicated a remarkable increase from 2013 to 2024: its value increased at an average annual rate of +5.8% over the last eleven-year period. The trend pattern, however, indicated some noticeable fluctuations being recorded throughout the analyzed period. The pace of growth was the most pronounced in 2021 with an increase of 42%. Over the period under review, the exports reached the maximum in 2024 and are likely to see steady growth in the near future.
Exports By Country
The United States (8.9K tons) was the main destination for garden tool exports from China, with a 27% share of total exports. Moreover, garden tool exports to the United States exceeded the volume sent to the second major destination, Australia (1.7K tons), fivefold. The UK (1.7K tons) ranked third in terms of total exports with a 5.1% share.
From 2013 to 2024, the average annual growth rate of volume to the United States stood at +2.9%. Exports to the other major destinations recorded the following average annual rates of exports growth: Australia (+7.1% per year) and the UK (+3.4% per year).
In value terms, the United States ($44M) remains the key foreign market for garden tools exports from China, comprising 28% of total exports. The second position in the ranking was taken by the UK ($8.2M), with a 5.3% share of total exports. It was followed by Australia, with a 5% share.
From 2013 to 2024, the average annual rate of growth in terms of value to the United States totaled +6.0%. Exports to the other major destinations recorded the following average annual rates of exports growth: the UK (+5.4% per year) and Australia (+9.4% per year).
Export Prices By Country
The average garden tool export price stood at $4,746 per ton in 2024, which is down by -3.7% against the previous year. In general, the export price, however, saw a noticeable increase. The most prominent rate of growth was recorded in 2016 when the average export price increased by 123%. As a result, the export price reached the peak level of $8,330 per ton. From 2017 to 2024, the average export prices remained at a somewhat lower figure.
Prices varied noticeably by country of destination: amid the top suppliers, the country with the highest price was Japan ($6,428 per ton), while the average price for exports to Saudi Arabia ($3,365 per ton) was amongst the lowest.
From 2013 to 2024, the most notable rate of growth in terms of prices was recorded for supplies to South Korea (+7.7%), while the prices for the other major destinations experienced more modest paces of growth.
Source: IndexBox Market Intelligence Platform
This report provides a comprehensive view of the garden tool industry in China, tracking demand, supply, and trade flows across the national value chain. It explains how demand across key channels and end-use segments shapes consumption patterns, while also mapping the role of input availability, production efficiency, and regulatory standards on supply.
Beyond headline metrics, the study benchmarks prices, margins, and trade routes so you can see where value is created and how it moves between domestic suppliers and international partners. The analysis is designed to support strategic planning, market entry, portfolio prioritization, and risk management in the garden tool landscape in China.
Quick navigation
Key findings
Domestic demand is shaped by both household and industrial usage, with trade flows linking local supply to imports and exports.
Pricing dynamics reflect unit values, freight costs, exchange rates, and regulatory shifts that affect sourcing decisions.
Supply depends on input availability and production efficiency, creating a distinct national cost curve.
Market concentration varies by segment, creating different competitive landscapes and entry barriers.
The 2035 outlook highlights where capacity investment and demand growth are most aligned within the country.
Report scope
The report combines market sizing with trade intelligence and price analytics for China. It covers both historical performance and the forward outlook to 2035, allowing you to compare cycles, structural shifts, and policy impacts.
Market size and growth in value and volume terms
Consumption structure by end-use segments
Production capacity, output, and cost dynamics
Trade flows, exporters, importers, and balances
Price benchmarks, unit values, and margin signals
Competitive context and market entry conditions
Product coverageProdcom 25731055 – Forks and other hand tools (excluding clasp knives) for agriculture, horticulture or forestryCountry coverageCountry profile and benchmarks
This report provides a consistent view of market size, trade balance, prices, and per-capita indicators for China. The profile highlights demand structure and trade position, enabling benchmarking against regional and global peers.
Methodology
The analysis is built on a multi-source framework that combines official statistics, trade records, company disclosures, and expert validation. Data are standardized, reconciled, and cross-checked to ensure consistency across time series.
International trade data (exports, imports, and mirror statistics)
National production and consumption statistics
Company-level information from financial filings and public releases
Price series and unit value benchmarks
Analyst review, outlier checks, and time-series validation
All data are normalized to a common product definition and mapped to a consistent set of codes. This ensures that comparisons across time are aligned and actionable.
Forecasts to 2035
The forecast horizon extends to 2035 and is based on a structured model that links garden tool demand and supply to macroeconomic indicators, trade patterns, and sector-specific drivers. The model captures both cyclical and structural factors and reflects known policy and technology shifts in China.
Historical baseline: 2012-2025
Forecast horizon: 2026-2035
Scenario-based sensitivity to income growth, substitution, and regulation
Capacity and investment outlook for major producing companies
Each projection is built from national historical patterns and the broader regional context, allowing the report to show where growth is concentrated and where risks are elevated.
Price analysis and trade dynamics
Prices are analyzed in detail, including export and import unit values, regional spreads, and changes in trade costs. The report highlights how seasonality, freight rates, exchange rates, and supply disruptions influence pricing and margins.
Price benchmarks by country and sub-region
Export and import unit value trends
Seasonality and calendar effects in trade flows
Price outlook to 2035 under baseline assumptions
Profiles of market participants
Key producers, exporters, and distributors are profiled with a focus on their operational scale, geographic footprint, product mix, and market positioning. This helps identify competitive pressure points, partnership opportunities, and routes to differentiation.
Business focus and production capabilities
Geographic reach and distribution networks
Cost structure and pricing strategy indicators
Compliance, certification, and sustainability context
How to use this report
Quantify domestic demand and identify the most attractive segments
Evaluate export opportunities and prioritize target destinations
Track price dynamics and protect margins
Benchmark performance against leading competitors
Build evidence-based forecasts for investment decisions
This report is designed for manufacturers, distributors, importers, wholesalers, investors, and advisors who need a clear, data-driven picture of garden tool dynamics in China.
FAQ
What is included in the garden tool market in China?
The market size aggregates consumption and trade data, presented in both value and volume terms.
How are the forecasts to 2035 built?
The projections combine historical trends with macroeconomic indicators, trade dynamics, and sector-specific drivers.
Does the report cover prices and margins?
Yes, it includes export and import unit values, regional spreads, and a pricing outlook to 2035.
Which benchmarks are included?
The report benchmarks market size, trade balance, prices, and per-capita indicators for China.
Can this report support market entry decisions?
Yes, it highlights demand hotspots, trade routes, pricing trends, and competitive context.
Comments are closed.