

Feb 8, 2026
IndexBox has just published a new report: GCC – Garden Tools – Market Analysis, Forecast, Size, Trends And Insights.
The article provides a comprehensive analysis of the garden tools market in the GCC from 2013-2024 with forecasts to 2035. In 2024, consumption surged to 3.1K tons (valued at $9.8M), led by Saudi Arabia, the UAE, and Oman. Production, however, contracted to 2.1K tons ($5.4M), with the UAE as the dominant producer. Imports rebounded to 1.8K tons, primarily to Saudi Arabia, while exports from the UAE fell sharply to 854 tons. The market is forecast to grow at a decelerating pace, reaching 3.5K tons and $12M by 2035. Key trends include significant per capita consumption in Oman and the UAE, and volatile import/export prices.
Key Findings
GCC garden tool consumption rebounded strongly in 2024 to 3.1K tons ($9.8M) after a two-year declineThe market is forecast to grow to 3.5K tons and $12M by 2035, but at a slower decelerating paceSaudi Arabia, the UAE, and Oman are the largest consumers, together accounting for 93% of total volumeThe UAE is the leading producer and exporter, while Saudi Arabia is the primary importerImport prices fell dramatically in 2024, while export prices saw a moderate increaseMarket Forecast
Driven by increasing demand for garden tools in GCC, the market is expected to continue an upward consumption trend over the next decade. Market performance is forecast to decelerate, expanding with an anticipated CAGR of +1.2% for the period from 2024 to 2035, which is projected to bring the market volume to 3.5K tons by the end of 2035.
In value terms, the market is forecast to increase with an anticipated CAGR of +1.8% for the period from 2024 to 2035, which is projected to bring the market value to $12M (in nominal wholesale prices) by the end of 2035.
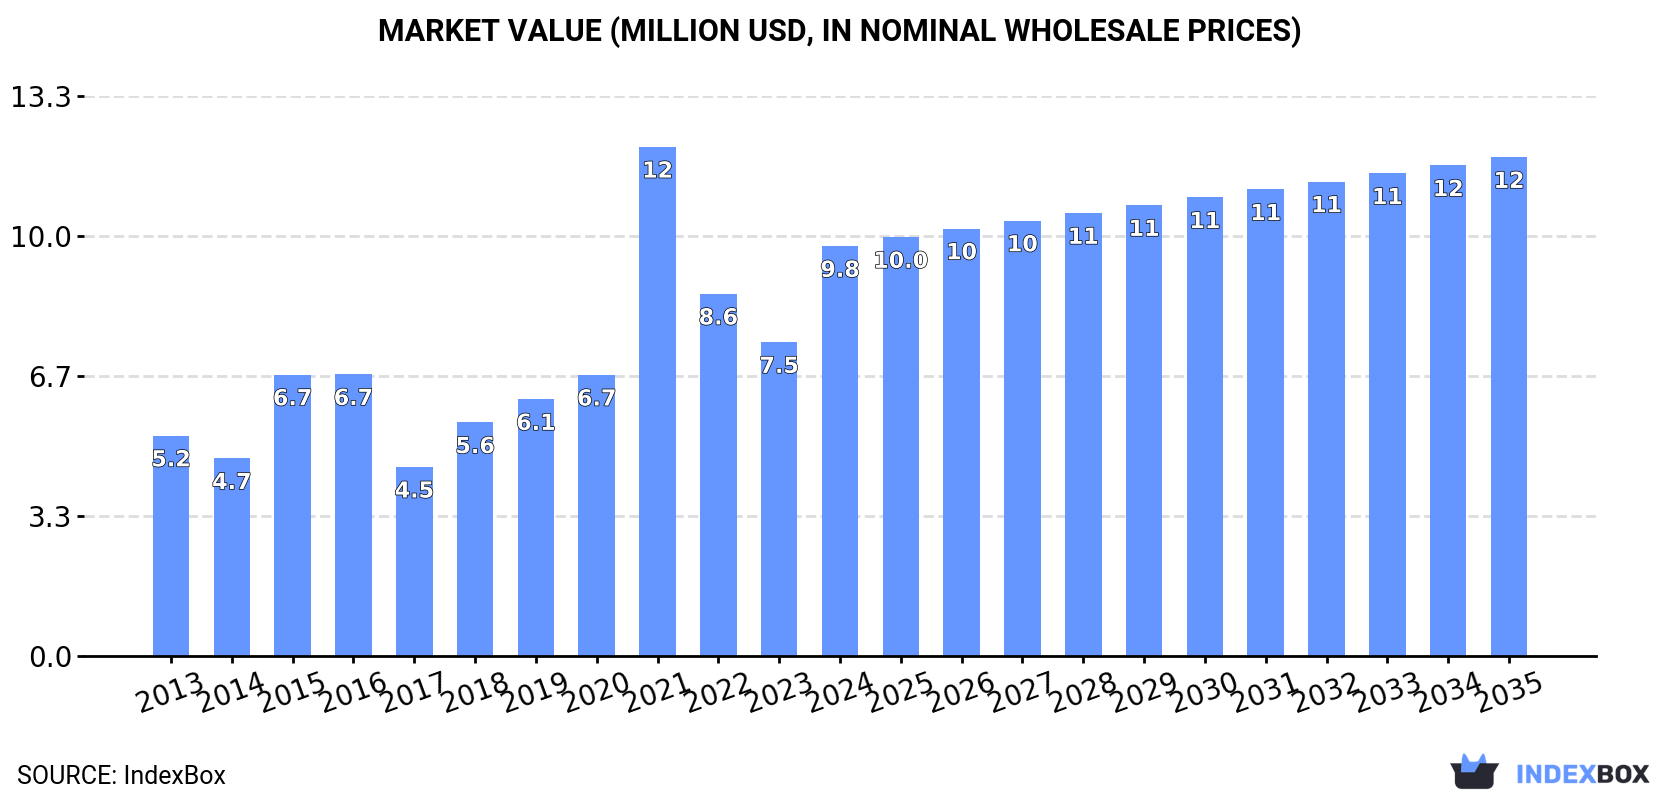 ConsumptionGCC’s Consumption of Garden Tools
In 2024, consumption of garden tools increased by 53% to 3.1K tons for the first time since 2021, thus ending a two-year declining trend. Over the period under review, consumption continues to indicate a prominent expansion. Over the period under review, consumption hit record highs at 3.5K tons in 2021; however, from 2022 to 2024, consumption remained at a lower figure.
The value of the garden tool market in GCC soared to $9.8M in 2024, picking up by 31% against the previous year. This figure reflects the total revenues of producers and importers (excluding logistics costs, retail marketing costs, and retailers’ margins, which will be included in the final consumer price). In general, consumption showed a prominent increase. As a result, consumption attained the peak level of $12M. From 2022 to 2024, the growth of the market failed to regain momentum.
Consumption By Country
The countries with the highest volumes of consumption in 2024 were Saudi Arabia (1.4K tons), the United Arab Emirates (969 tons) and Oman (520 tons), with a combined 93% share of total consumption. Bahrain and Qatar lagged somewhat behind, together comprising a further 6.2%.
From 2013 to 2024, the biggest increases were recorded for Qatar (with a CAGR of +20.3%), while consumption for the other leaders experienced more modest paces of growth.
In value terms, Saudi Arabia ($4.1M), the United Arab Emirates ($2.5M) and Oman ($2.2M) were the countries with the highest levels of market value in 2024, with a combined 90% share of the total market.
Among the main consuming countries, Saudi Arabia, with a CAGR of +13.1%, recorded the highest rates of growth with regard to market size over the period under review, while market for the other leaders experienced more modest paces of growth.
The countries with the highest levels of garden tool per capita consumption in 2024 were Oman (95 kg per 1000 persons), the United Arab Emirates (95 kg per 1000 persons) and Bahrain (74 kg per 1000 persons).
From 2013 to 2024, the most notable rate of growth in terms of consumption, amongst the key consuming countries, was attained by Qatar (with a CAGR of +17.6%), while consumption for the other leaders experienced more modest paces of growth.
ProductionGCC’s Production of Garden Tools
In 2024, approx. 2.1K tons of garden tools were produced in GCC; with a decrease of -26.7% on 2023 figures. In general, production, however, recorded resilient growth. The most prominent rate of growth was recorded in 2015 with an increase of 133% against the previous year. Over the period under review, production reached the maximum volume at 2.9K tons in 2023, and then fell notably in the following year.
In value terms, garden tool production contracted markedly to $5.4M in 2024 estimated in export price. Overall, production, however, continues to indicate strong growth. The pace of growth was the most pronounced in 2021 with an increase of 144%. As a result, production reached the peak level of $7.8M. From 2022 to 2024, production growth remained at a lower figure.
Production By Country
The United Arab Emirates (1.4K tons) remains the largest garden tool producing country in GCC, accounting for 67% of total volume. Moreover, garden tool production in the United Arab Emirates exceeded the figures recorded by the second-largest producer, Oman (518 tons), threefold. Bahrain (126 tons) ranked third in terms of total production with a 5.9% share.
In the United Arab Emirates, garden tool production increased at an average annual rate of +20.9% over the period from 2013-2024. The remaining producing countries recorded the following average annual rates of production growth: Oman (+8.7% per year) and Bahrain (+2.4% per year).
ImportsGCC’s Imports of Garden Tools
After two years of decline, purchases abroad of garden tools increased by 100% to 1.8K tons in 2024. Over the period under review, imports recorded a relatively flat trend pattern. As a result, imports reached the peak and are likely to continue growth in the immediate term.
In value terms, garden tool imports contracted to $6.1M in 2024. Overall, imports posted a mild increase. The most prominent rate of growth was recorded in 2021 with an increase of 93% against the previous year. As a result, imports attained the peak of $8.3M. From 2022 to 2024, the growth of imports remained at a somewhat lower figure.
Imports By Country
In 2024, Saudi Arabia (1.4K tons) represented the key importer of garden tools, creating 76% of total imports. It was distantly followed by the United Arab Emirates (386 tons), mixing up a 21% share of total imports.
Saudi Arabia was also the fastest-growing in terms of the garden tools imports, with a CAGR of +9.0% from 2013 to 2024. the United Arab Emirates (-7.1%) illustrated a downward trend over the same period. While the share of Saudi Arabia (+44 p.p.) increased significantly in terms of the total imports from 2013-2024, the share of the United Arab Emirates (-30.7 p.p.) displayed negative dynamics.
In value terms, the largest garden tool importing markets in GCC were Saudi Arabia ($3.3M) and the United Arab Emirates ($2.4M).
Among the main importing countries, Saudi Arabia, with a CAGR of +10.8%, recorded the highest rates of growth with regard to the value of imports, over the period under review.
Import Prices By Country
The import price in GCC stood at $3,340 per ton in 2024, with a decrease of -54.9% against the previous year. Over the period under review, the import price, however, continues to indicate a relatively flat trend pattern. The growth pace was the most rapid in 2023 when the import price increased by 117% against the previous year. As a result, import price reached the peak level of $7,409 per ton, and then declined notably in the following year.
There were significant differences in the average prices amongst the major importing countries. In 2024, amid the top importers, the country with the highest price was the United Arab Emirates ($6,253 per ton), while Saudi Arabia amounted to $2,345 per ton.
From 2013 to 2024, the most notable rate of growth in terms of prices was attained by the United Arab Emirates (+5.4%).
ExportsGCC’s Exports of Garden Tools
In 2024, exports of garden tools in GCC fell markedly to 854 tons, reducing by -52.4% on the year before. Over the period under review, exports, however, saw a strong increase. The pace of growth appeared the most rapid in 2023 with an increase of 732% against the previous year. As a result, the exports reached the peak of 1.8K tons, and then declined significantly in the following year.
In value terms, garden tool exports dropped rapidly to $1.7M in 2024. In general, exports, however, enjoyed resilient growth. The most prominent rate of growth was recorded in 2023 when exports increased by 773%. As a result, the exports attained the peak of $3M, and then fell significantly in the following year.
Exports By Country
The United Arab Emirates (851 tons) represented roughly 100% of total exports in 2024.
The United Arab Emirates was also the fastest-growing in terms of the garden tools exports, with a CAGR of +9.4% from 2013 to 2024. The United Arab Emirates (+13 p.p.) significantly strengthened its position in terms of the total exports, while the shares of the other countries remained relatively stable throughout the analyzed period.
In value terms, the United Arab Emirates ($1.7M) also remains the largest garden tool supplier in GCC.
From 2013 to 2024, the average annual growth rate of value in the United Arab Emirates amounted to +7.6%.
Export Prices By Country
The export price in GCC stood at $1,955 per ton in 2024, increasing by 16% against the previous year. Over the period under review, the export price, however, showed a mild downturn. The most prominent rate of growth was recorded in 2017 when the export price increased by 55% against the previous year. The level of export peaked at $3,992 per ton in 2019; however, from 2020 to 2024, the export prices remained at a lower figure.
As there is only one major export destination, the average price level is determined by prices for the United Arab Emirates.
From 2013 to 2024, the rate of growth in terms of prices for the United Arab Emirates amounted to -1.6% per year.
Source: IndexBox Market Intelligence Platform
This report provides a comprehensive view of the garden tool industry in GCC, tracking demand, supply, and trade flows across the regional value chain. It explains how demand across key channels and end-use segments shapes consumption patterns, while also mapping the role of input availability, production efficiency, and regulatory standards on supply.
Beyond headline metrics, the study benchmarks prices, margins, and trade routes so you can see where value is created and how it moves between exporters and importers within GCC. The analysis is designed to support strategic planning, market entry, portfolio prioritization, and risk management in the garden tool landscape in GCC.
Quick navigation
Key findings
Regional demand is shaped by both household and industrial usage, with trade flows linking supply hubs to import-reliant countries.
Pricing dynamics reflect unit values, freight costs, exchange rates, and regulatory shifts that affect sourcing decisions.
Supply depends on input availability and production efficiency, creating distinct cost curves across GCC.
Market concentration varies by country, creating different competitive landscapes and entry barriers.
The 2035 outlook highlights where capacity investment and demand growth are most aligned within the region.
Report scope
The report combines market sizing with trade intelligence and price analytics for GCC. It covers both historical performance and the forward outlook to 2035, allowing you to compare cycles, structural shifts, and policy impacts across countries and sub-regions.
Market size and growth in value and volume terms
Consumption structure by end-use segments and countries
Production capacity, output, and cost dynamics
Regional trade flows, exporters, importers, and balances
Price benchmarks, unit values, and margin signals
Competitive context and market entry conditions
Product coverageProdcom 25731055 – Forks and other hand tools (excluding clasp knives) for agriculture, horticulture or forestryCountry coverageCountry profiles and benchmarks
For the regional report, country profiles provide a consistent view of market size, trade balance, prices, and per-capita indicators across GCC. The profiles highlight the largest consuming and producing markets and allow direct benchmarking across peers.
Methodology
The analysis is built on a multi-source framework that combines official statistics, trade records, company disclosures, and expert validation. Data are standardized, reconciled, and cross-checked to ensure consistency across time series.
International trade data (exports, imports, and mirror statistics)
National production and consumption statistics
Company-level information from financial filings and public releases
Price series and unit value benchmarks
Analyst review, outlier checks, and time-series validation
All data are normalized to a common product definition and mapped to a consistent set of codes. This ensures that comparisons across time are aligned and actionable.
Forecasts to 2035
The forecast horizon extends to 2035 and is based on a structured model that links garden tool demand and supply to macroeconomic indicators, trade patterns, and sector-specific drivers. The model captures both cyclical and structural factors and reflects known policy and technology shifts within GCC.
Historical baseline: 2012-2025
Forecast horizon: 2026-2035
Scenario-based sensitivity to income growth, substitution, and regulation
Capacity and investment outlook for major producing countries
Each country projection is built from its own historical pattern and the regional context, allowing the report to show where growth is concentrated and where risks are elevated.
Price analysis and trade dynamics
Prices are analyzed in detail, including export and import unit values, regional spreads, and changes in trade costs. The report highlights how seasonality, freight rates, exchange rates, and supply disruptions influence pricing and margins.
Price benchmarks by country and sub-region
Export and import unit value trends
Seasonality and calendar effects in trade flows
Price outlook to 2035 under baseline assumptions
Profiles of market participants
Key producers, exporters, and distributors are profiled with a focus on their operational scale, geographic footprint, product mix, and market positioning. This helps identify competitive pressure points, partnership opportunities, and routes to differentiation.
Business focus and production capabilities
Geographic reach and distribution networks
Cost structure and pricing strategy indicators
Compliance, certification, and sustainability context
How to use this report
Quantify regional demand and identify the most attractive country markets
Evaluate export opportunities and prioritize target destinations
Track price dynamics and protect margins
Benchmark performance against regional competitors
Build evidence-based forecasts for investment decisions
This report is designed for manufacturers, distributors, importers, wholesalers, investors, and advisors who need a clear, data-driven picture of garden tool dynamics in GCC.
FAQ
What is included in the garden tool market in GCC?
The market size aggregates consumption and trade data at country and sub-regional levels, presented in both value and volume terms.
How are the forecasts to 2035 built?
The projections combine historical trends with macroeconomic indicators, trade dynamics, and sector-specific drivers.
Does the report cover prices and margins?
Yes, it includes export and import unit values, regional spreads, and a pricing outlook to 2035.
Which countries are profiled in detail?
The report provides profiles for the largest consuming and producing countries in GCC.
Can this report support market entry decisions?
Yes, it highlights demand hotspots, trade routes, pricing trends, and competitive context.
Comments are closed.