
Meta-analysis of a broad literature
While thousands of publications discuss indoor agriculture, only 748 identified through bibliographic search reference energy use, among which 116 provide adequate data for analysis and intercomparisons. The 154 evaluated locations span a broad range of climates and potential solar energy resources (latitudes −0°S to 71°N) in 40 countries and Antarctica, with few located in lower-income countries (Fig. 1) (Table S1). These studies emerge from diverse research communities, the earliest dating from 1993 followed by low publication levels throughout the ensuing 25 years, after which activity increased markedly.
Fig. 1: Studies providing usable quantitative assessments of energy use in controlled environment agriculture (CEA).
a Map marker size and shading density reflect the number of measured or modeled cases at each location (two sites in Antarctica are not shown). Data sources provided in the Supplementary Information. b Assignment of research domain corresponds to the disciplinary focus of the publication. Reasons for the increase in publication activity likely reflect rising concern about the costs of energy and its environmental impacts, as well as increasing focus on whether CEA can contribute to climate resilience.
In reviewing the literature, no limitations were placed on geography, cultivation scale, or type of crop. Some were research or demonstration facilities, but all were represented as relevant to commercial production. Inclusion of studies in the compilation required sufficient data to determine aggregate energy use and yields for an entire year (often involving multiple cultivation cycles) and to compute normalized energy per unit yield (MJ/kg) or energy per unit production area (MJ/m2 growing surface). Cases were excluded where major fuels or uses were omitted, seasonal variations not accurately captured, energy needs reported only indirectly in terms of greenhouse-gas emissions, or commercial “on-farm” energy use combined with that of labor, solar gains, or off-farm uses. Some sources were excluded where authors confused energy use with peak electricity demands and/or results were expressed in terms of loads, i.e., not accounting for on-site conversion efficiencies.
The identified literature includes measured or modeled energy use for 486 cultivation trials and 23 crop types, with 57% of the estimates being model-based and 43% measurement-based, the latter cohort representing 1686 production sites with an aggregate cultivation area of 14.6 million m2. Of all cases, 59% were in greenhouses and 41% in plant factories. Energy use values for open-field cultivation use were offered for comparison in only 12 of the studies.
Orders-of-magnitude variation in energy use
The compiled energy intensities exhibit extraordinary variability (Figs. 2a, b and 3a–h). Differences are evident among and within crop types, facility types, and geographies. Other potential causes of divergence include yields per unit of growing area, energy efficiency, and various lighting factors including type, contribution of daylight, illuminance levels (PPFD), and artificial lighting on-times (photoperiod).
Fig. 2: Ranges of annual energy use intensity per yield and per unit growing area by facility type, energy efficiency features, modeled vs measured data, and crop type.
a Eenergy use per unit yield indicates cultivation energy intensity, while (b) energy use per cultivation area indicates facility energy intensity. Boxplot threshold percentiles: 5th, 25th, 75th, 95th with “X” indicating medians. Specific crops included in the “Leafy greens” category: arugula/rocket, chicory, spinach, miscellaneous brassicas. Specific crops included in the “Other and mixed” category: eggplant, potato, and unspecified mixtures of crops included in a single trial. The number of cases underlying each range bar are noted in the x-axis labels. Data sources are provided in the Supplementary Information.
Fig. 3: Annual energy use intensity per unit yield and per unit of growing area, by yield density.
Results by crop type are shown in (a, b), by facility type in (c, d), by presence or absence of energy efficiency measures in (e, f), and by modeled versus measured analysis in (g, h). Each symbol indicates a cultivation trial in the meta-analysis for which the corresponding metric can be calculated. Yields reflect total annual amounts harvested per growing surface (kg/m2-y) which in most cases occur multiple times each year and often on more than one growing level or surface, particularly in plant factories. Cases lacking yield density are not plotted. Corresponding values for open-field crops provided in some of the CEA studies are shown in (c, d). The tendency towards lower yields and lower energy intensities for open-field cultivation is evident. Sample sizes are indicated in the legends. Crops included in some of the aggregated categories are defined in the caption to Fig. 2 and the data and sources are provided in the Supplementary Information.
Lettuce and tomatoes exhibit loosely overlapping energy intensities, while herbs and leafy greens tend to be somewhat more energy intensive, cucumbers the least energy-intensive, and cannabis the most energy-intensive crop by orders of magnitude (Fig. 4a, b). Approaching the lower bound of cannabis are soybeans and wheat (gray and black markers) which are both found to be uneconomic given the high required energy inputs–despite use of LED lighting, high-efficiency heating and cooling systems, and a well-insulated facility envelope in the case of wheat. Microgreens are also among the more energy-intensive crops.
Fig. 4: End-use allocation of total energy consumption for a variety of controlled environment agriculture (CEA) operations.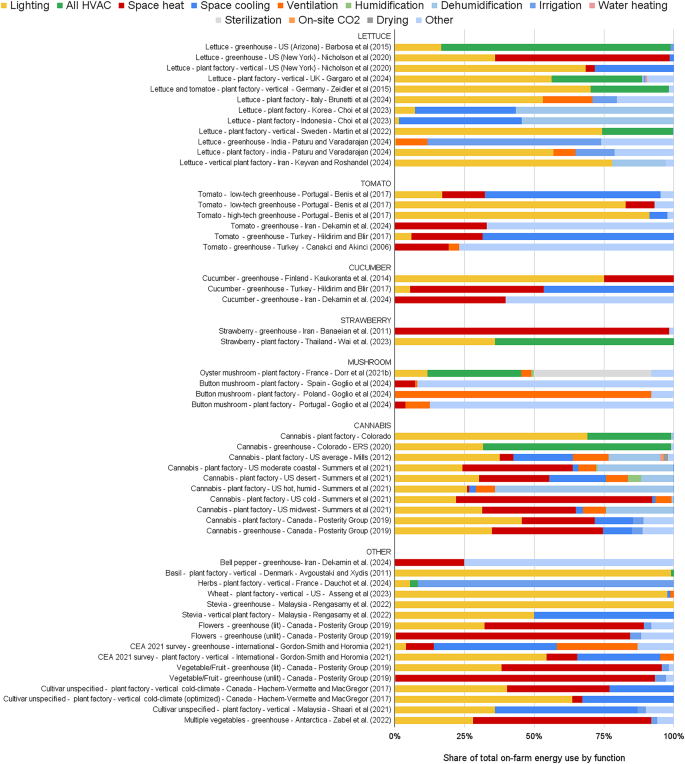
Each bar represents one site and cultivation trial. HVAC (heating, ventilating, and air-conditioning) is noted where these three categories are combined. “On-site CO2” pertains to production and/or distribution of CO2 in the cultivation environment to increase growth. The “Other” category can be large when significant uses are uncategorized in the source publication. Data sources are provided in the Supplementary Information.
When grouped by facility type (Fig. 4c), greenhouses are the least energy-intensive (median 27 MJ/kg), followed by plant factories (127 MJ/kg) which includes 23,300 MJ/kg for cannabis and 78 MJ/kg for non-cannabis crops. While not always identifiable in the source literature, less-mechanized “open” greenhouses appear to operate between 1.5 and 5 MJ/kg. Yield intensities (kg/m2-y) in greenhouses fully overlap with those of plant factories, with far less energy input, an observation that has been made by others20. For comparison, the median value for open-field crops is only ~1 MJ/kg.
Depending on metric, median energy intensities of facilities without identified energy-efficiency measures are only 1% (MJ/kg) and 3% (MJ/m2-y) higher than those with one or more efficiency features (Fig. 3a–f) although the variation is expectedly greater for those not identifying the presence of energy efficiency features (Fig. 2a, b). While individual side-by-side studies clearly show energy savings from efficiency measures, many other factors appear to have more influence on the overall sample outcomes. Energy intensities are uncorrelated with facility size for both metrics (Fig. S1).
No substantial differences between energy use for modeled and measured results are evident (Fig. 3g, h). Detailed validations of models against measured data for a given facility are uncommon. Model results appear to assume systematically higher annual yields — which translates to lower energy intensities — perhaps reflecting idealized conditions and neglecting real-world factors such as crop losses.
Energy consumption at the end-use level is disaggregated in 191 cases (Fig. 4). This information is valuable for understanding drivers of energy use and identifying opportunities to improve energy efficiency. For example, dehumidification represents more than half of total energy use for cannabis cultivation in hot and humid locations while heating is negligible compared to cold climates where dehumidification is minimal and heating represents about two-thirds of total energy use. Wide variations in end-use shares are notable even for a given crop or facility type.
This large and diversified sample reveals findings not captured by less-comprehensive studies, and distinguishes energy intensities by crop and facility type. It also provides a counterpoint to claims based on far smaller samples that energy use is largely insensitive to climate13,21,22,23,24. End-use analysis also helps scrutinize rules-of-thumb, e.g., that all plant factories have the same end-use breakdowns23 or the assumption that a multiplier of 1.25 can be readily applied to lighting energy to obtain total energy use25,26,27. In practice, per Fig. 4, artificial lighting can constitute between ~0% and ~95% total energy use.
Extreme CEA: Arctic and Antarctic applications are particularly energy-intensive
CEA facilities are operated by five countries in Antarctica28 to produce food and conduct research for space-based applications. Interestingly, despite minimum temperatures of −43.5 °C, greenhouses with ultra-high-efficiency envelopes are employed in some cases to take advantage of daylight and minimize fuel use or costly solar installations. Measured energy intensities of ~17,000 MJ/kg for mixed vegetables7 are among the highest in the meta-analysis, and more than 200-times greater than the median for food production.
Energy intensities of ~6000 MJ/kg occur for cucumbers in container farms in the Canadian arctic8, where fresh produce must otherwise be flown into Inuit villages. Despite the waste heat from lighting and dehumidification meeting nearly all heating needs, nearly 50 kW of on-site renewable energy and battery storage, plus diesel generator backup, is needed to support this modest 6.7 m2 growing area.
In Icelandic greenhouses, heat is required year-round, with supplemental lighting much of the year, along with summertime cooling29. Significant additional energy use is associated with melting snow from greenhouse glazing. Energy intensities are 2600–5800 MJ/kg for low-calorie crops such as lettuce and tomatoes.
The cannabis conundrum: the most energy-intensive crop
Cannabis emerges as the most energy-intensive crop (Figs. 2 and 3), and represents approximately 95% of present-day US CEA crop value30,31. About 63% of this cannabis (legal and illicit) is produced in CEA facilities, representing 17% of the country’s overall CEA facility footprint. Little data on cannabis cultivation is available for other countries.
Likely drivers for the relative energy inefficiency include the yield being measured in dry- rather than wet-weight, high crop losses from interdiction and other factors, high proportions of unused and woody biomass (low harvest index), long cultivation cycles (~70 days) and photoperiods (12–18 h/d), higher lighting intensities (PPFDs up to 1323 micromoles/m2/s) creating corresponding elevated cooling needs, lower tolerable humidity levels (50–60%), unsuitability for multi-layer vertical farming, higher air-circulation rates, and higher levels of CO2 enrichment than most food crops (1000–1200 ppm are common).
In the U.S., cannabis has become the largest cash crop, while releasing CO2 emissions at the rate of ten million cars with an energy expenditure of $11 billion each year31. While there is general debate about the environmental merits of urban agriculture11, the expansion of factory-farm cannabis cultivation into cities has raised distinct secondary energy issues, including strain on power grids, significant power outages, and environmental justice concerns31.
Notably, the broader literature on CEA crop production is virtually devoid of reference to cannabis, while that on cannabis rarely provides comparisons to other crops. LCA analyses for cannabis are rare31,32,33.
Energy is a constraint to producing essential staple crops
Multiple studies find that because fruits, cereals, legumes, seeds, root crops, and other high-protein/high-calorie staple crops are significantly more energy-intensive than crops such as lettuce and herbs they cannot be cost-competitively produced under CEA15,20,29,34,35. For example, even at scale, strawberries from CEA facilities are priced at ten-times that of their field-grown equivalents4.
In another study, soybeans had among the highest energy intensity26 of all food crops in this meta-analysis. While yields were up to six-times greater than open-field soybeans, energy intensity was 1000- to 2000-times greater, even with energy-efficient LED lighting.
Asseng et al.34 model a hypothetical 18,225 m2, 10-story wheat-production facility with high energy efficiency (insulation, heat pumps, LED lights, and heat-recovery ventilation). To maximize yields (63-times greater than field-grown wheat), very high illuminance levels (5- to 10-times that of most other studies in this compilation) are assumed to be delivered 24 h per day, with natural background levels of atmospheric CO2 tripled (to 1200 ppm) to accelerate plant growth. Estimated energy costs for the facility are $16 M/y based on an inexplicably low assumed price of $0.02/kWh – versus an average US industrial price of $0.09/kWh in summer 202436 – representing 77% of total operational costs, or $13/kg yield, greatly exceeding the value of the commodity.
Prospects for greater adoption of energy efficient technologies are constrained
In a global survey of greenhouse and plant-factory operators37, two thirds report not employing any energy efficiency strategies. Providing insight as to why uptake is low, another industry survey identified multiple barriers, in order of decreasing severity: upfront costs (compounded by narrow profit margins), access to capital and financing, lack of knowledge, skepticism and lack of trust in the performance of efficient technologies, lack of executive support, and insufficient training38. Cultivators of even the most energy-intensive crops demand, on average, a rapid 4-year payback time on their energy efficiency investments39. While some qualitative assessments are optimistic9, model studies document a limited cost-effective energy savings potential of <10% for most measures in cannabis farms40, which should be among the most promising applications given the high energy use and expenditures.
The benefits of LED lighting have been found to be highly variable. In field trials, Leichleiter et al.41 found energy savings ranging from negligible to substantial depending on cultivar. Measurement-based studies for tomato production found LED lighting required augmentation with less-efficient high-pressure sodium (HPS) lighting42. The efficacy of LED products appears to also be an issue, given the 2.2-fold variance in yields of microgreens per unit of energy depending on LED manufacturer43.
Facility energy efficiencies among the sites included in the meta-analysis vary widely, with some having single-glazing, combustion heating systems, minimal insulation, low-efficiency lighting, and deficiencies in system operation44. However, compared to the aforementioned industry surveys, a disproportionate number of studies in the meta-analysis involved one or more energy-efficiency measures (Fig. 3e, f). Such measures were reported in 50% of the studies and 70% of the cases (individual measurement trials or model runs), including 60% with LEDs, 24% with heat pumps, 15% with insulation, 3% with evaporative cooling, 2% with economizer cooling, and 1% with multiple glazing. The potential for energy efficiency – within a given CEA facility type – is thus already partly captured, while facility operators perceive many barriers to further adoption.
For indoor agriculture (and all other industries) the primary path to full decarbonization requires conversion of all energy uses to electricity, and then producing that electricity with renewable energy. Electrification also offers unique opportunities for energy efficiency (e.g., heat pumps instead of combustion heating). Just under 60% of the facilities reviewed here are all-electric. If not provided for at the time of construction, capital requirements for such conversions are substantial.
Process change can reduce or increase energy efficiency
The choice of CEA facility type (greenhouse instead of plant factory) is perhaps the single-most impactful determinant of energy efficiency. A few studies document other promising forms of process change. These include measures such as reducing photoperiod and light intensity in the case of Stevia45, growing strawberry runners outdoors before bringing them into the controlled environment for flowering and fruiting35, and varying fertigation techniques, light levels, lighting location, and greenhouse operation46. Light deprivation is commonly used in plant-factory and greenhouse operations to compress cultivation times for cannabis and certain other crops, thereby reducing energy requirements. Pennisi et al.47 varied the spectrum of LED lighting, finding variations in energy use for lettuce (1.5x) and chicory (1.2x). Field tests in Australia48 found that optimizing planting dates can yield energy savings in cool winters. Increasing yield was found to improve efficiency for tomatoes bred to also thrive at slightly lower temperatures49. One particularly effective case study utilized root-zone cooling for cucumbers in the extreme United Arab Emirates climate, lowering energy use by 20-fold while maintaining yields50. While AI may play a role in attaining operational benefits24, it also requires substantial energy inputs.
Cultivar choice can also impact energy use, yet only one-quarter of cases in this review identify the exact cultivar, and few of these explore the energy implications. Almeida et al.51 attribute some of their observed differences in energy intensity to the choice of tomato cultivars. Leichleiter et al.41 found a 6-fold difference in energy intensity of different types of cannabis cultivated in otherwise identical plant factories. It is proposed that genetic engineering can develop cultivars that grow better under energy-efficient LED lighting52.
Site selection is also a key variable. One study53 found that the most energy-efficient approach to cucumber greenhouse cultivation in Norway was summertime cultivation in the southern part of the country, with moveable glazing insulation and no artificial lighting. Replicating that same method in the north increased energy intensity by 51%, with 11% reduced yields.
Conversely, efficiency losses can arise from efforts to increase yields. Early efforts to increase yields in the Netherlands included increased CO2 enrichment, which was produced by burning fossil fuels on site54. Elevating CO2 levels requires increased light levels to support amplified photosynthesis, which, in turn, boosts transpiration and dehumidification energy needs. In another example, reducing temperatures for tomato greenhouses in a hot desert climate resulted in an 18% increase in energy use for a 0.35% increase in yield55. Some studies found that yields level off or even decline appreciably with increasing light inputs, and, conversely, in some cases greenhouses without artificial light achieve less energy input per unit of yield without sacrificing product quality20,42,46,56,57. Microgreen yields declined by 23% in Chile as light application was increased by 144% while energy intensity increased 72%58. Qualitatively similar results were observed in Russia59. In southern Norway, while intensified cucumber production with artificial lighting, cooling, and year-round cultivation tripled yields, it also increased energy intensity by 88%53.
In a further complication, certain efforts to reduce non-energy environmental impacts can increase energy use. For example, water recovery from exhaust air is energy intensive20 and steam-cleaning soils for re-use rather than disposal60 can double on-farm energy use.
Shifting to renewable energy can negate the land-use benefits of intensive indoor cultivation
The elevated yields of CEA facilities are often credited with creating “freed” or “spared” land that can ostensibly be returned to a wild state4. In response to concerns about energy use, it is also commonly stated that CEA facilities can become more sustainable if fully powered with renewable energy to achieve net-zero emissions – yet these propositions rarely quantify the associated land requirements.
Individual case studies8,34,61,62,63,64,65,66,67 report that on-site solar electricity would require land areas ranging from 2- to 100-times the facility’s floor area – often more than that needed for open-field cultivation. A techno-economic optimization for US-based greenhouses (which are significantly less energy-intensive than plant factories) found the approach not to be cost-effective except in the mildest climates68. Moreover, diversion of renewable energy for discretionary indoor cultivation is problematic given the current need to dramatically reduce global emissions in other sectors in order to manage rising climate risk, while the practical constraints on renewable energy expansion are many, ranging from ecological to cultural conflicts17,20,31.
Figure 5 shows the standardized area required to meet all on-farm energy needs with solar photovoltaic (PV) power for cases in the meta-analysis. In all cases, the array area exceeds the building footprint. The average ground-mounted PV area (panels in excess of what will fit on the roof) required for food-producing greenhouses is 4-times their building footprint, 48-times for food-producing plant factories, and 122-times for cannabis-producing plant factories. In the best cases, highly energy-efficient greenhouses (envelope, lighting, and equipment) in an ideal solar climate (Turkey) required an array area equal to building footprint, but this outcome is rare. The largest solar arrays are required for energy-intensive crops and vertical-farming facilities for food crops with multiple cultivation layers and/or multiple-stories. The extreme case, a skyscraper lettuce-production greenhouse in a sunny Los Angeles location would require a PV array ~600-times its footprint to meet target lighting levels beyond what daylight provides. Inconveniently, multi-layer vertical farming ostensibly spares the most land (albeit before counting the solar requirements)4.
Fig. 5: Solar photovoltaic (PV) system ground-mounted area needed to achieve 100% on-site renewable energy production as a multiple of controlled environment agriculture (CEA) facility footprint.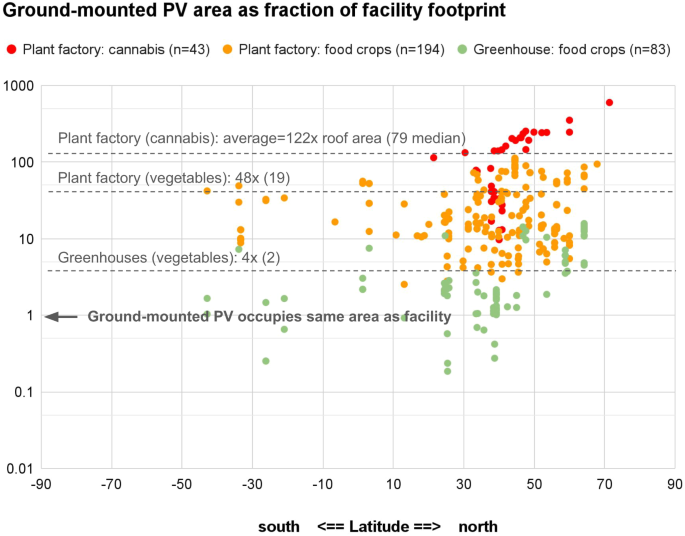
Each data point indicates a case in the meta-analysis for which the metric can be calculated (N = 330). A value of 1 indicates that the required solar array would effectively double the operation’s land use. Sites achieving low values tend to be greenhouses using only daylight, with energy use limited to ventilation and irrigation and perhaps other minor loads. However, since greenhouse structures require translucent roofs, those arrays are assumed to be fully ground-based. Facilities with no exact location or non-electric (or unknown) energy types are excluded. Only the all-electric subset of the sample is shown, with the exception of US and Canadian cannabis sites to define the upper boundary of potential electricity demand, for which existing fuel-based heating (80% efficiency) is modeled as converted to electric heat pumps (COP 3.5). Even without area constraints, on-site applications in lower latitudes would typically require grid interties or short-term diurnal storage, and backup power that may have associated carbon emissions would be needed at higher latitudes with seasonal darkness. Existing facilities using a mix of fuels would need to first invest in costly equipment change-outs that would enable conversion to 100% electricity.
In the US, typical ratios of CEA to open-field yields per unit of land area include: cucumbers 22:1, lettuces 12-21:1, peppers 6-12:1, 4.9:1 for cannabis, tomatoes 4:1, and strawberries 1.4:110,69. As can be seen in Fig. 5, the required additional solar land areas are generally much higher than these multiples. Not included in the analysis is land area for electrical transmission lines, fossil fuel mining and processing, or other renewable energy land uses (hydroelectric, wind, etc.). While no all-electric open-field cases were identified, such farms would only require a minor fractional expansion of land area to achieve net-zero emissions with solar PV. Moreover, the ratios shown above compare conventional open-field results rather than best practices (which use less land area), suggesting that optimal open-field cultivation could be even more competitive on a land-use basis.
Energy-determinative dynamics of controlled environment agriculture: technologies and markets
Narratives describing advantages of CEA compared to open-field agriculture inform the assessment of energy needs and environmental impact4,9,45,70,71. Key stated benefits include control of environmental factors (temperature, light, humidity), shortened crop cycles, an extended growing season, and increasing output with high predictability. The degree to which yields exceed those of open-field farming varies widely as a function of cultivar and practices, and outdoor conditions where competing open-field cultivation would occur10. Other stipulated benefits include reduced transportation energy in delivering crops to market, exposure to pests and natural hazards, land-area requirements, soil degradation and erosion, fertilizer use, water use, soil-derived greenhouse-gas emissions, odor nuisance, food-safety risks, and commodity shrinkage and spoilage if facilities are located closer to markets. These technical aspirations are often rhetorically tied to broader goals including environmental protection, public health, and affordable and equitable availability of food for a growing land-constrained population.
For each of these stated advantages are caveats and countervailing concerns15. In some cases, unique collateral problems are associated with energy and mechanization and bringing cultivation closer to population centers, including light pollution and odor nuisance72. Reduced transport distances do not predictably lower overall carbon footprints15. More broadly, in an intrinsic contradiction, greenhouse-gas emissions from CEA’s energy use—which can exceed that of open-field cultivation—exacerbate the very climate risks the practice is hoped to shield against11. Disaster-resilience is an oft-cited benefit73, although CEA has acutely greater vulnerability to utility disruptions (power and water) than open-field agriculture, more costly potential damage to cultivation infrastructure, and substantial added capital cost for backup electricity generation and nuisance while in operation. The advantages of CEA in terms of water and land requirements only hold when moderate open-field yields are assumed and system boundaries omit the land and water required for energy production69.
Nonetheless, CEA has high appeal and is well-established for certain crop types and geographies. For example, most microgreens and commercial mushrooms are grown in plant factories. Geographically-isolated Iceland imports about two-thirds of its vegetables, by calorie count29, while the land-constrained island state of Singapore imports 90% of its food74. Greenhouses provide one-third of fresh vegetables imported to the US from Mexico10, ~60% of vegetable production in Iran75,76, and virtually all non-summer cultivation in Siberia77. In Norway, virtually all tomatoes, 90% of cucumbers, and 13% of lettuce are grown in greenhouses78. The highest-value crops are the most viable, as in the case of cannabis for which US wholesale prices are ~$2000/kg, yet, energy costs remain a concerning factor and one-third of production continues to be conducted outdoors31.
The scale of CEA practices is increasing. Globally, greenhouses occupy an estimated land area of 1.3–3.7 million ha – an unknown fraction being heated or artificially illuminated – of which closed glass houses comprise ~70 kha79,80. No reliable estimates have been identified for plant factories, but they likely number in the low thousands of hectares. As an illustration at the national scale, CEA production in the US occurs in in ~11,000 greenhouse farms, spanning 19.4 Mm2 plus 3.1 Mm2 for mushrooms30 and 4.6 million m2 for cannabis cultivation in a mix of greenhouse and plant-factory settings81 (Table S2).
On-farm energy use is a leading determinant of overall climate impacts from crop production (Table 1). Energy uses include electricity, diesel, natural gas, propane, coal, biofuels, on-site renewable energy, and industrial waste heat76,82,83,84,85,86,87 Energy needs are driven by artificial lighting, heating, space cooling due to solar gains in greenhouses and substantial waste-heat from lighting, and dehumidification. For certain crops and geographies, greenhouses can avoid the need for artificial lighting, but since artificial lighting can increase yields, and provide sometimes-useful waste heat, many greenhouses rely heavily on it87. Secondary energy-using activities include ventilation, irrigation water temperature control, crop drying, water pumping and irrigation, snow-melting, carbon-dioxide enrichment, post-harvest soil steaming for disinfection, water recovery and on-site treatment, harvesting and other on-site crop handling or processing, cold storage, robotics or other automation, and AI or other computing associated with process control.
Table 1 Role of direct on-farm energy in total energy use and environmental footprint
In addition to technical issues are energy-related market challenges. CEA capital costs–much of which trace to energy infrastructure–far exceed those for open-field agriculture and are reported to range from $550–$1600/m2 for greenhouses and $1600–$4300/m2 for plant factories88. Some authors note that capital costs are orders of magnitude higher for CEA than for open-field operations, and a single facility can cost hundreds of millions of dollars4,89. Land costs are also higher in urban and peri-urban areas, which is where CEA is often proposed as a means of reducing food-transportation distances.
As a reflection of these costs, many CEA producers fail to attain profitability89. Operating costs for energy constitute a larger share of expenses than most other industries (Table 2) – and were at the root of early vertical farming start-up bankruptcies5,9,15,20,67,90. A late-1970s effort known as Phytofarms was abandoned by General Mills in 1982, purchased by another entity (for $20 M in today’s dollars), and operated until 1992, with utility costs named as a major factor in its ultimate bankruptcy4. Other well-capitalized companies (Google, General Electric, GTE, Sylvania, and Weyerhaeuser) also abandoned early efforts4. The current-day cannabis industry also faces solvency issues, tied in part to energy intensity31. Energy costs are ultimately borne by consumers in the form of elevated commodity prices, which can negate socioeconomic benefits of growing nearer to the point of demand, particularly for lower-income consumers35,91,92.
Table 2 CEA facility energy expenses as a percentage of total operating costsContextualizing aggregate energy demand for indoor agriculture
It is helpful to put the energy intensity of CEA in context with other uses, and to similarly assess the aggregate energy demand. As an illustration, the median energy intensity (MJ/m2-y) for food crops grown in plant factories is 5-times that of the average US office building, while for the most intensive food crops the ratio is 90-times greater. Righini et al.26 estimate of 16 MWh to provide a year’s worth of protein per person with soybeans grown in plant factories is on par with the requirements of an all-electric home with two electric vehicles. Moreover, while the energy embodied in producing 1 kg of usable protein from open-field soybeans ranges from 1.5 to 3% that of producing that same protein from beef, soybeans grown in plant factories require 4500- to 9000-times more energy than open-field farming and thus 60- to 120-times more than producing protein via beef (Table S3).
The literature review revealed no prior estimates of aggregate national energy use associated with CEA, aside from cannabis31,93. Results of this meta-analysis enable the determination that current on-farm energy use for 15 primary CEA food crops (representing 7.4% of all yields of those crops) is 735 PJ/year, exceeding that to produce all crops under open-field conditions (Table S4)94. Approximately half this energy use is attributable to cannabis cultivation. The total CEA food- crop production is <1% of all US food-crop supply (~7% of vegetables), by weight, and much less by calorie content. The cultivation area represented in this analysis is only about one-fifth the total protected area when including crops such as bedding plants, florist products, hemp, nursery plants, and sod (Table S2).
CEA energy demand is currently ~1% of the US total (all sectors). In a scoping estimate in which all applicable crops are produced in plant factories (Fig. 6), this would increase to up to 7% of all US energy consumption (10-times current energy use for all open-field crops) (Table S5), exceeding that of many other segments of the economy (Fig. 7). The hypothetical land area required to produce this CEA energy with solar photovoltaic arrays would be triple that currently used for outdoor production of these same crops.
Fig. 6: Scoping estimate of present and future US energy demand for controlled environment agriculture (CEA).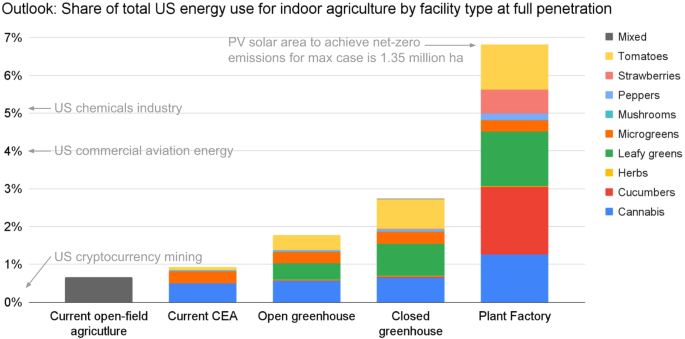
Aggregate national CEA energy use is estimated by applying average energy intensities from this meta-analysis to US current and projected CEA output plus net imports. Excludes crops known to be grown in CEA but for which sufficient energy data are unavailable: blueberries, chard, eggplant, string beans, hemp, floriculture, ornamental plants, and home cultivation or greenhouses for producing transplant starts for any crop. To derive the estimate for current CEA cultivation, crops are mapped to the dominant facility types in today’s market (plant factories for mushrooms and microgreens, other food crops to greenhouses, and cannabis to a 36% plant factory/27% greenhouse mix per Mills31. In each future-oriented scenario, crops are progressively mapped to higher-yield facilities at maximum penetration so as to define an upper limit of potential energy use. The sole identified estimate for national energy use for open-field food crops is 528 PJ/y94. Estimated current-day total CEA energy use is 735 PJ/y, 0.9% of 2023 US final energy consumption. These results are expressed in terms of energy consumed at the site, enabling focus on facility performance and processes therein, independent of the thermal losses or fuel-mix of upstream power-generation. Scenarios exclude energy use for staple crops such as grains, legumes, and root crops, nuts, and most fruits, which are not suitable for CEA and thus continued to be grown in open-field conditions. Data and assumptions in Table S5.
Fig. 7: Energy use of controlled environment agriculture in context: US.
Adding energy for cultivation of tobacco and malting barley increases Beverages and Tobacco value by ~14%. Cryptocurrency mining is a subset of data centers. Open-field agriculture, current CEA, and maximum saturation CEA scenario from this study. Data and sources in Table S6.
Improving assessment practices: Nuances of energy analysis and benchmarking
The choice of energy metrics is critical to meaningful performance benchmarking16,95. In the energy literature, CEA facilities are typically rated in terms of energy per unit of floor area44,62,67,68,87,96, a metric useful for energy-infrastructure planning, assessing burdens on the grid, etc. The choice of net cultivation area or gross facility area (e.g., including aisles or office areas) can have a marked effect on computed intensities, but the distinction is often not made in the CEA literature. Metrics based on yield are standard in the agronomy and LCA literature – and in the agricultural industry itself – illuminating the energy-efficiency of the cultivation process while being insensitive to definition of planted area or cultivation periods. Occasionally, other functional units are used, e.g., sweetener metabolite for Stevia45, kilocalories for mushrooms97, protein for soybeans26, or potency for cannabis41.
Defining a system boundary that articulates which energy-using processes are considered is essential to achieving clear and usable metrics. In practice, the literature is often imprecise in these definitions or otherwise quantitatively or conceptually ambiguous, e.g., regarding inclusion of energy inputs during production of seedlings or clones. Some studies omit specific energy types such as fuel for heating, end uses such as cooling, on-site electricity generation by diesel generators, or energy used on-site to produce CO2, post-harvest processing, cold storage, etc. Others normatively include only single energy uses, e.g., heating98,99, or lighting27,100, or only measure total energy use while lighting is on13,101,102, heating and cooling103,104, during only part of the cultivation cycle105, only seasonally106, or during even briefer periods of monitoring thus missing the seasonal effects of fluctuations in weather and daylighting107. Test facilities are sometimes located inside other buildings47,108, with studies failing to measure the heating and cooling provided from the surrounding conditioned space.
The literature can also present incommensurate values with respect to the system boundary. For example, in some cases a portion of the injected CO2 is made on-site and part off-site53,109. Similarly, one study counted irrigation energy and substantial post-harvest weight loss due to commodity shrinkage during transport for open-field operations but not for CEA operations91. In an assessment of mushroom cultivation, the most energy-intensive process (composting) was conducted on-farm in one case and off-farm in another, resulting in a ten-fold difference in energy intensity between facilities that reflected energy accounting rather than actual energy efficiency110. Some assessments include energy input from human labor and sunlight (in the form of heat as well as illumination).
Other nuances arise from study duration and net yields. Most CEA crops can be grown multiple times each year. To extrapolate annual energy use from a single reported cycle one must know the cycle duration and any possible seasonal limitations or yield variability. The energy use embodied in pre- and post-harvest crop losses should also be added to the calculations, but rarely is. Cannabis is particularly impacted in this latter respect through a combination of losses due to disease (mold outbreaks are common), interdiction, and product destruction or recalls due to consumer safety testing failures that can collectively result in 20% losses nationally31.
Studies reporting only carbon footprint19,111,112 have limited usefulness for energy analysis since the underlying energy intensity and types of constituent fuels and electricity are obscured, which is important when evaluating tradeoffs between fossil-fuel transport and electrified cultivation. Even studies providing both views show that emissions comparisons can obscure differences in underlying energy use91. This is particularly problematic when outcomes from countries with low-emissions electricity are compared to those with more carbon-intensive grids113. An emissions focus can mask caveats to conclusions and policy recommendations, as in a study set in Sweden which found lower CO2 emissions for vertically-farmed lettuce and basil than for field-grown lettuce commonly imported from southern Europe108. As Sweden’s grid is almost entirely based on zero-emissions nuclear and hydroelectric power, recalibration of those results to US conditions results in a 20-fold increase in total CEA emissions. Another Swedish study found domestic emissions below those of crop imports only in summer, excluding cooling energy114.
A model-based assessment of tomato production in Norwegian greenhouses further illuminates how assumptions can shape findings. Surprisingly, summertime cultivation in un-lit greenhouses was found to be more carbon-intensive than year-round cultivation. This arose from inappropriately comparing summer heating at low efficiency with fossil fuels and in some cases less facility insulation to heat pumps and lighting in winter at high efficiency powered with carbon-free hydroelectric electricity82. Wintertime heating is thus decarbonized and waste heat from electric light further substitutes for fuel. The comparisons also appear to involve variations in the mix of CO2 produced on-site with fossil fuel vs. purchased CO2 canisters for which the embodied energy and carbon is outside the system boundary and thus not counted. The evaluation of facility characteristics and seasonality are thus conflated with the influences of fuel, heating efficiencies, lighting, and perhaps varying system boundary conditions. With identical heating fuels and efficiencies, seasonal summer production would have the lowest carbon footprint per unit yield.
Improving assessment practices: Joint of measurement and modeling
Some CEA energy estimates are measurement-based while others are modeled. Measurement provides a “ground-truth” of sorts, albeit often with caveats, and helps identify potentially unmodeled uses (e.g., snow-melting on greenhouses). Modeling allows explicit articulation of system boundaries; annualized estimation under long-term average weather; and assessment of sensitivity to interior climate setpoints, building geometry, and outdoor climatic conditions while accounting for energetic trade-offs between factors such as lighting and cooling loads as a function of solar gains. Co-modeling of energy together with evapotranspiration, photoperiod, and other crop dynamics captures implications for energy-using processes such as dehumidification or lighting needs and how yields may vary as a function of energy inputs (Table 3).
Table 3 Uses of controlled environment agriculture energy model studies
Model studies also offer advantages insofar as they control for or at least make transparent the “noisy” drivers underlying measured data, and enable rapid and less costly parametric analyses and scenario studies44,67 but are also susceptible to specification error and unrealistic assumptions. Energy-agronomy interactions are complex and challenging to model, while empirical data intrinsically captures the effects.
Comparing model results to measured data can help design, validate, and calibrate models and ensure realism35,44,67,68,115,116,117,118,119,120. Measurement and modeling can be combined to achieve more comprehensive assessments8,31,56. While estimating the benefits of energy efficiency measures is far easier with modeling – especially for ensembles of measures — some studies44,46,121 have done so in actual facilities, providing added confidence in the findings.
Assumptions often favor CEA over open-field cultivation and transport energy use
The literature occasionally compares CEA outcomes to open-field practices (Fig. 3c, d), often citing values for different crops and geographies and comparing optimized and high-tech indoor methods to average open-field practices (rather than best practices). CEA yields for “protected” practices are reported to be 1.5 to 20-times greater than open-field cultivation, depending on crop10. More intensive open-field methods have been documented to increase yields by 2- to 3-fold122,123 above standard practices, which would reduce the yield gap by half to two-thirds and correspondingly widen the differences in energy intensity in favor of open-field cultivation. It is rare that analyses offer sensitivities to baseline open-field energy use or emissions reductions as a function of energy efficiency or renewable energy.
Reduced transport energy is a prime argument given in favor of CEA practices. In practice, transport emissions can vary by nearly a factor of four, even among internal-combustion vehicles15, but truck shipping at low fuel economies is the typical default assumption. Actual outcomes are tempered by stipulated transport distances, mode (e.g., truck, train, ship, air), energy efficiency (energy per tonne-km), fuel choice (e.g., diesel, electric), logistics (return cargo), and other factors. In contrast to typical stipulations, one of the larger US CEA facilities routes its products through a Walmart distribution center hundreds of kilometers from the ultimate point of sale124. Nicholson et al.91 isolate transportation and cultivation energy use for lettuce production in the US, concluding that the combined total in greenhouses and plant factories is 24 to 69% lower for open-field cultivation, even with pessimistic assumptions of cross-country transport distances 1400-times greater for field-grown than plant-factory crops, and inefficient diesel truck transport (3 km/l). Van Ginkel et al. 125 find that cross-country US transport energy use does not exceed that of plant-factory energy use closer to the point of demand.
Comments are closed.